 Stay
Stay 
Trading Conditions
Products
Tools


Inflation in the USA in August increased to 3.7%, surpassing the consensus forecast of 3.6%. The main reason for the acceleration was the rise in gasoline prices in August. Meanwhile, the growth of consumer prices excluding food and energy slowed down in August to the lowest level since September 2021, reaching 4.3% on an annual basis after rising by 4.7% in July, but these figures aligned with analysts' expectations.
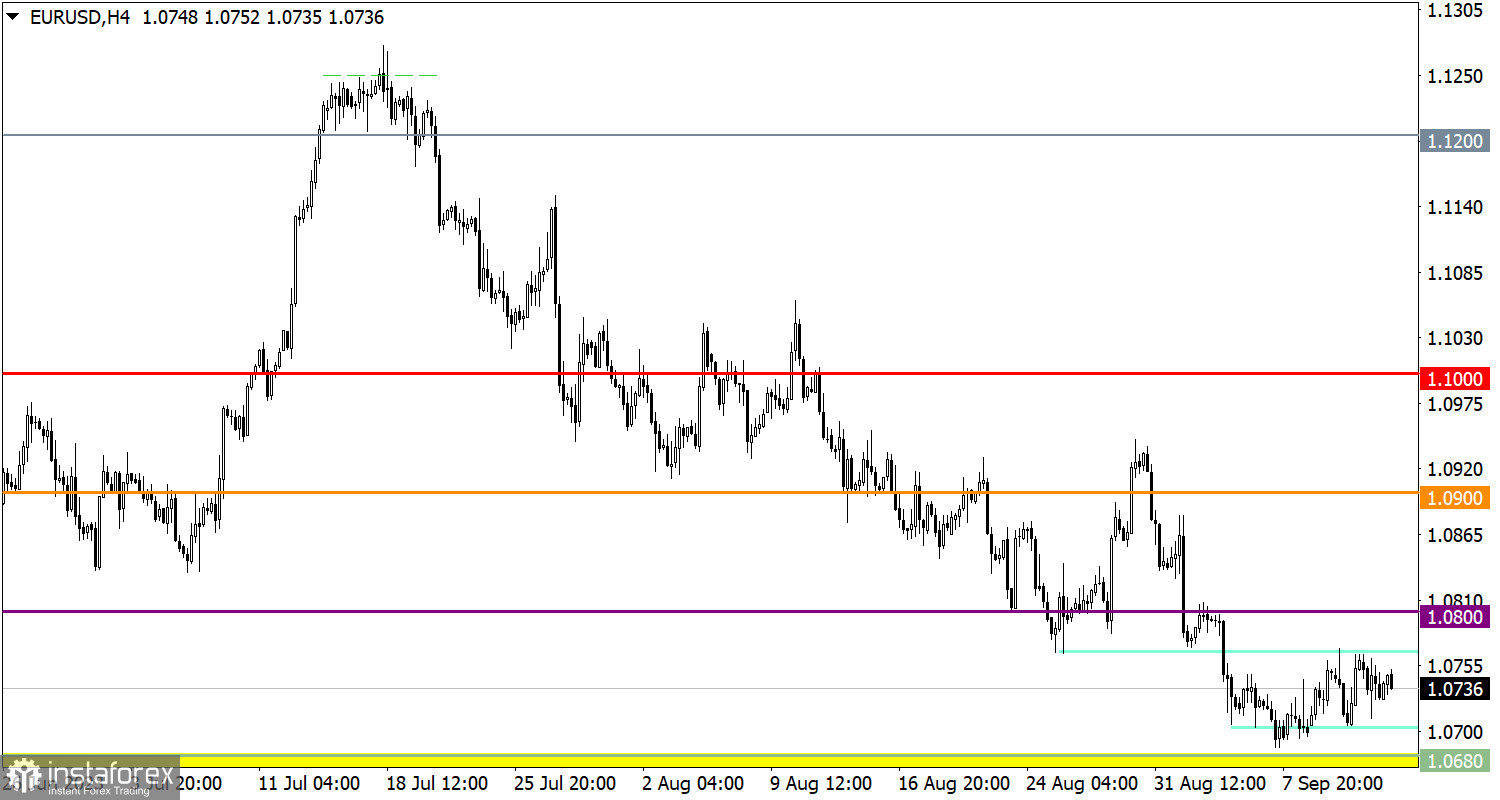
The EUR/USD currency pair is in the midst of a pullback from the zone of interaction of trading forces within the range of 1.0650/1.0680. This movement did not lead to radical changes and eventually transitioned into a stagnant phase, indicating pressure from sellers.
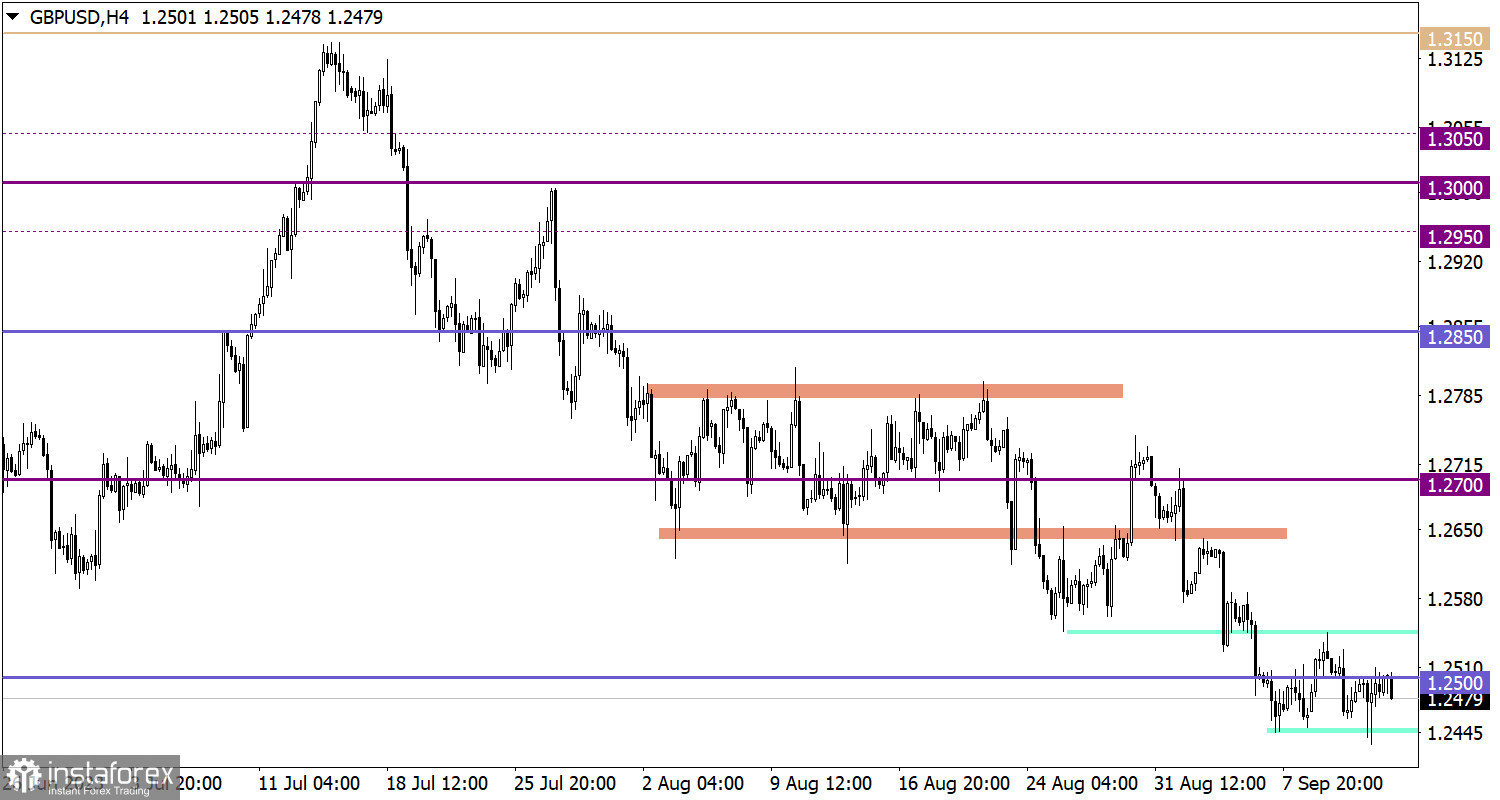
The GBP/USD pair temporarily updated the local low of the downward cycle due to speculative price fluctuations. However, it failed to stay below the level of 1.2450 and subsequently returned to the original range of 1.2450/1.2550.
The European Central Bank (ECB) will hold its monthly meeting today, where it will need to make a complex decision regarding monetary policy.
Traders have different views on whether the ECB will raise rates again or prefer to pause the tightening cycle, considering signals of economic growth slowdown. If the ECB decides to keep rates unchanged after the meeting, it may face criticism. Some may argue that the regulator is ending the fight against inflation too soon, while further rate hikes could exacerbate economic problems.
Following the announcement of the meeting's outcomes, ECB President Christine Lagarde will hold a press conference, and her comments may trigger speculations in financial markets.
Timetable
ECB Meeting Outcome - 12:15 UTC
ECB Press Conference - 12:45 UTC
The closed cycle of fluctuations, limited within the range of 1.0700 to 1.0770, may be a phase of accumulation of trading forces, the completion of which could trigger market speculations. If the price is maintained above or below the specified boundaries, it may lead to the emergence of an impulsive movement. Within the upward scenario, the impulse may head towards at least the level of 1.0800 with subsequent strengthening of long positions. Within the downward scenario, an update of the current local low is possible.
In the current situation, traders are paying special attention to the temporary amplitude between the levels of 1.2450 and 1.2550. Holding the price above or below one of these levels may indicate the completion of a flat phase. This, in turn, can provide a technical signal regarding the direction of future price movement.
The candlestick chart type is white and black graphic rectangles with lines above and below. With a detailed analysis of each individual candle, you can see its characteristics relative to a particular time frame: opening price, closing price, intraday high and low.
Horizontal levels are price coordinates, relative to which a price may stop or reverse its trajectory. In the market, these levels are called support and resistance.
Circles and rectangles are highlighted examples where the price reversed in history. This color highlighting indicates horizontal lines that may put pressure on the asset's price in the future.
The up/down arrows are landmarks of the possible price direction in the future.
InstaForex analytical reviews will make you fully aware of market trends! Being an InstaForex client, you are provided with a large number of free services for efficient trading.
Your IP address shows that you are currently located in the USA. If you are a resident of the United States, you are prohibited from using the services of Instant Trading EU Ltd including online trading, online transfers, deposit/withdrawal of funds, etc.
If you think you are seeing this message by mistake and your location is not the US, kindly proceed to the website. Otherwise, you must leave the website in order to comply with government restrictions.
Why does your IP address show your location as the USA?
Please confirm whether you are a US resident or not by clicking the relevant button below. If you choose the wrong option, being a US resident, you will not be able to open an account with InstaForex anyway.
We are sorry for any inconvenience caused by this message.


