 Stay
Stay 
Trading Conditions
Products
Tools


Trend-following analysis (picture 1)
This week, EUR/USD could begin the downward move from 1.0914, the closing level of the last weekly candlestick, with a target of 1.0864, the 14.6% retracement level plotted by the yellow dotted line. If this level is tested, the price could extend its upward move with a target at 1.0974, the 61.8% retracement level plotted by the red dotted line.
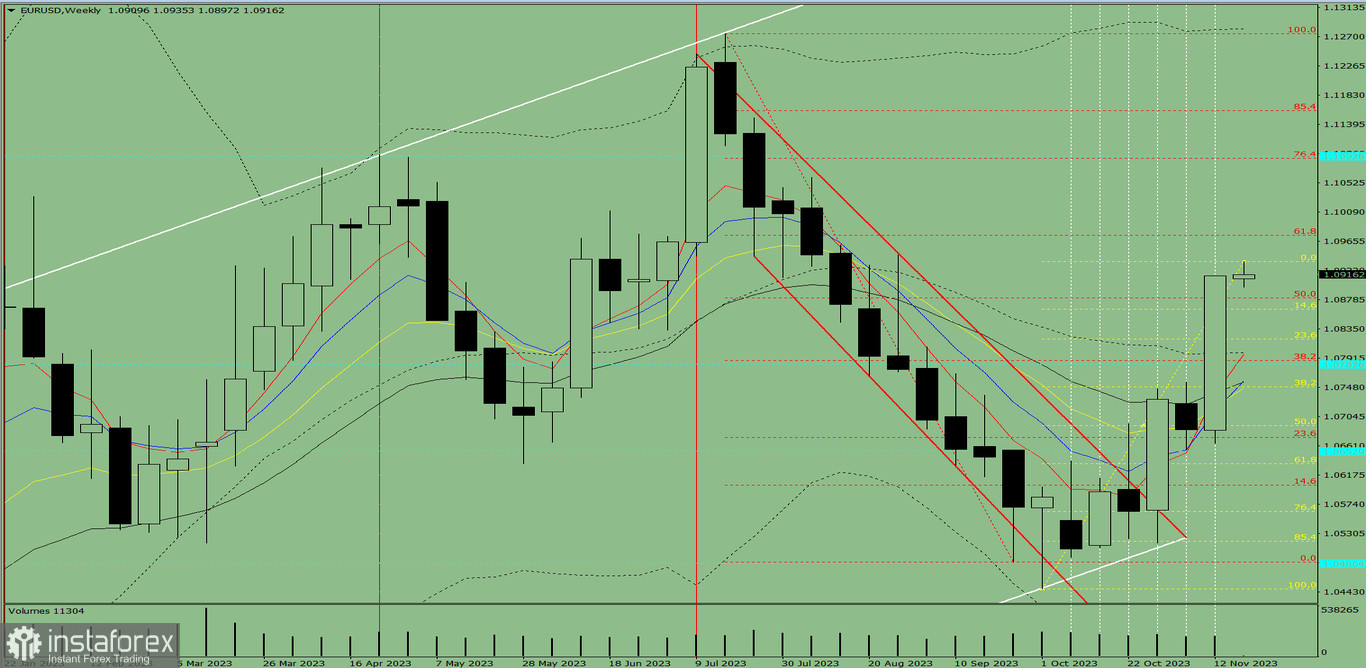
Picture 1, weekly chart
Complex analysis
Complex analysis suggests the overall downtrend.
The conclusion for EUR/USD on the weekly timeframe is that the instrument is expected to follow the downtrend this week. The weekly bearish candlestick is likely to lack the first upper shadow, pointing downward on Monday. The candlestick has the second lower shadow, pointing upward on Friday.
This week, EUR/USD could begin the downward move from 1.0914, the closing level of the last weekly candlestick, with a target of 1.0864, the 14.6% retracement level plotted by the yellow dotted line. If this level is tested, the price could extend its upward move with a target at 1.0974, the 61.8% retracement level plotted by the red dotted line.
Alternative scenario. EUR/USD might start a downward move from 1.0914, the closing level of the last weekly candlestick, with a target at 1.0881 which is the 50% retracement level plotted by the red dotted line. When this level is tested, the price could reverse its trajectory upward with a target at 1.0974, the 61.8% retracement plotted by the red dotted line.
InstaForex analytical reviews will make you fully aware of market trends! Being an InstaForex client, you are provided with a large number of free services for efficient trading.

