 Stay
Stay 
Trading Conditions
Products
Tools


Monday was traditionally accompanied by an empty macroeconomic calendar. The publication of important statistical data in the European Union, the United Kingdom, and the United States is not anticipated. However, we observed a subsequent sell-off of dollar positions, as investors are inclined to believe that the Federal Reserve will no longer raise interest rates and will soon announce a cycle of rate cuts. This is evident from the yield of twenty-year bonds of the United States federal government, which decreased from 5.245% to 4.780%.

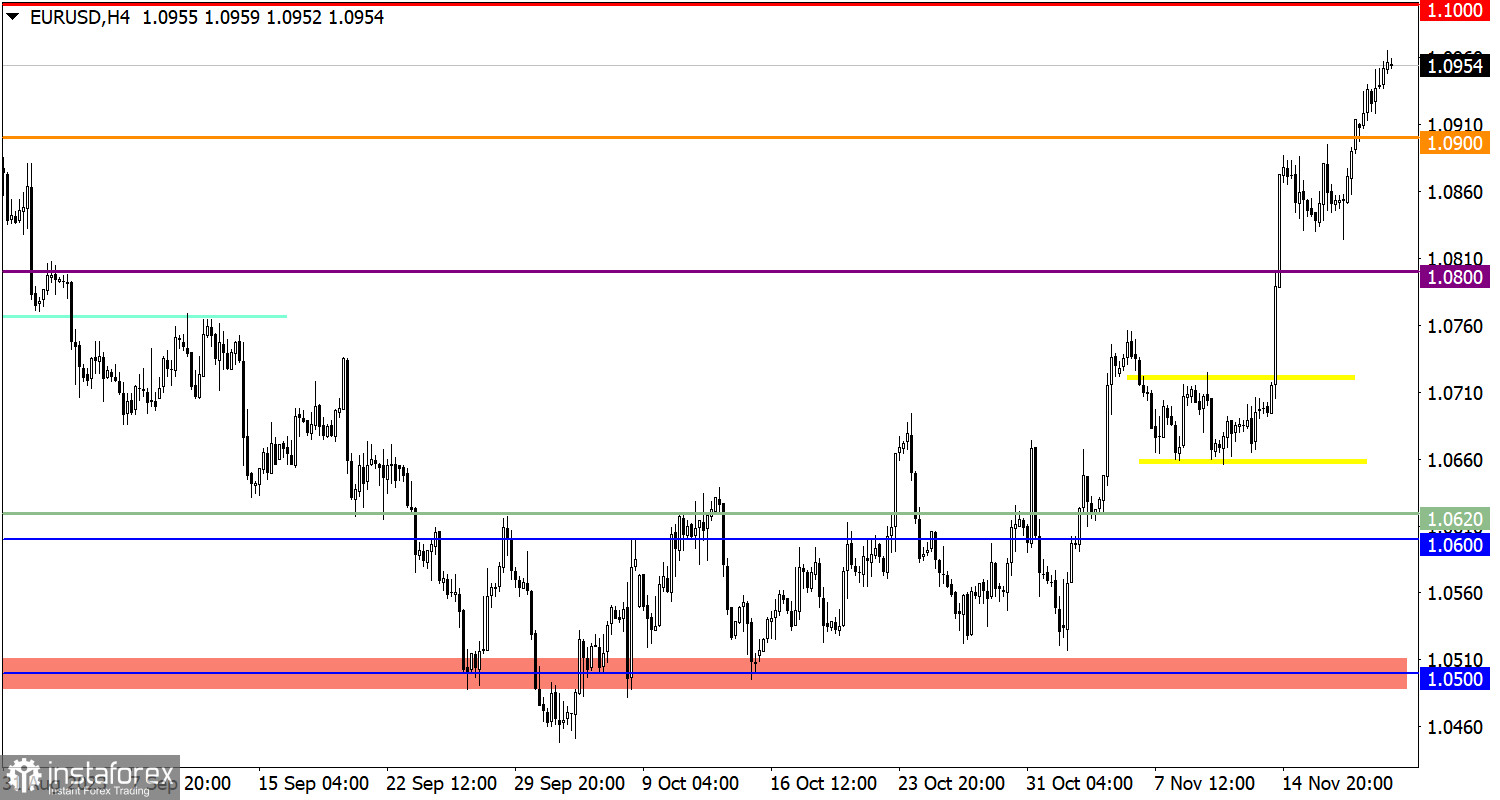
The EUR/USD currency pair, in the course of inertia-speculative movement, rose above the value of 1.0950. This price move indicates a prevailing bullish sentiment among market participants, who are ignoring the growing technical signal of the overbought condition of the euro.
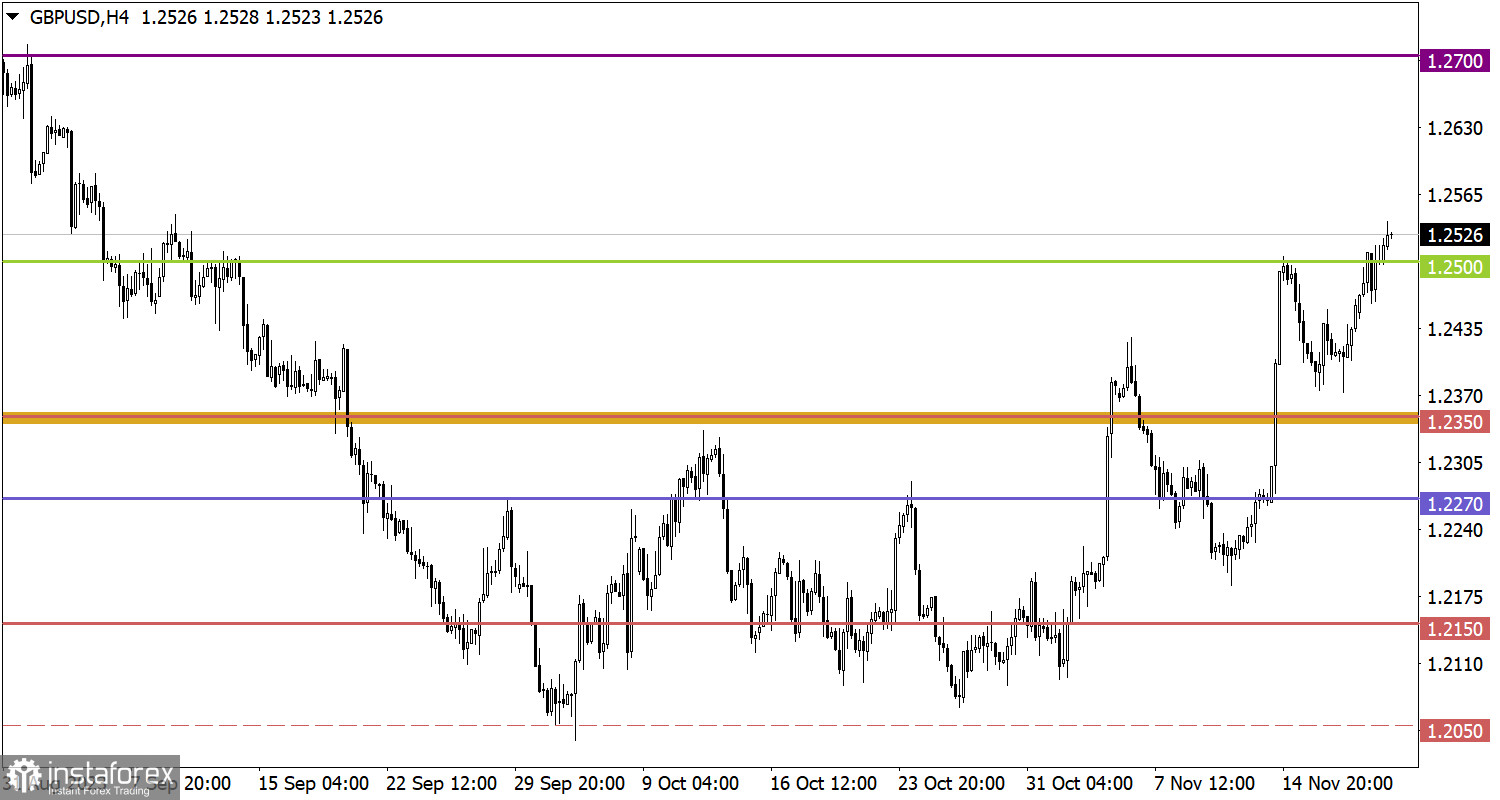
The GBP/USD pair managed to recover previously lost positions and broke through the resistance level of 1.2500. As a result, the price consolidation occurred above the level, indicating a prolonged upward cycle.
Today, the publication of data on existing home sales in the United States is expected, where a decline of 1.3% is forecasted. This is a negative factor that may lead to further selling of dollar positions in the market.
In the case of further growth, touching the psychological level of 1.1000 is possible. This is the first possible target on the path of buyers seeking to resume the euro's course relative to the decline during the summer. However, attention should not be diverted from the technical signal of the overbought condition of the euro, as touching the level of 1.1000, in theory, can lead to a reduction in the volume of long positions, resulting in a local price pullback.
In the case of further growth, a scenario of a phased recovery in the value of the British pound relative to the decline from mid-July to late September will be considered by traders. However, if the upward cycle is interrupted, and the quote stabilizes below the 1.2500 mark, it may indicate a temporary weakening of the pound or a possible flat cycle.
The candlestick chart type is white and black graphic rectangles with lines above and below. With a detailed analysis of each individual candle, you can see its characteristics relative to a particular time frame: opening price, closing price, intraday high and low.
Horizontal levels are price coordinates, relative to which a price may stop or reverse its trajectory. In the market, these levels are called support and resistance.
Circles and rectangles are highlighted examples where the price reversed in history. This color highlighting indicates horizontal lines that may put pressure on the asset's price in the future.
The up/down arrows are landmarks of the possible price direction in the future.
InstaForex analytical reviews will make you fully aware of market trends! Being an InstaForex client, you are provided with a large number of free services for efficient trading.
We may place cookies for analysis of our visitor data, to improve our website and measure advertising performance. Overall this data is used to provide a better website experience. More information
Your IP address shows that you are currently located in the USA. If you are a resident of the United States, you are prohibited from using the services of Instant Trading EU Ltd including online trading, online transfers, deposit/withdrawal of funds, etc.
If you think you are seeing this message by mistake and your location is not the US, kindly proceed to the website. Otherwise, you must leave the website in order to comply with government restrictions.
Why does your IP address show your location as the USA?
Please confirm whether you are a US resident or not by clicking the relevant button below. If you choose the wrong option, being a US resident, you will not be able to open an account with InstaForex anyway.
We are sorry for any inconvenience caused by this message.


