 Stay
Stay 
Trading Conditions
Products
Tools


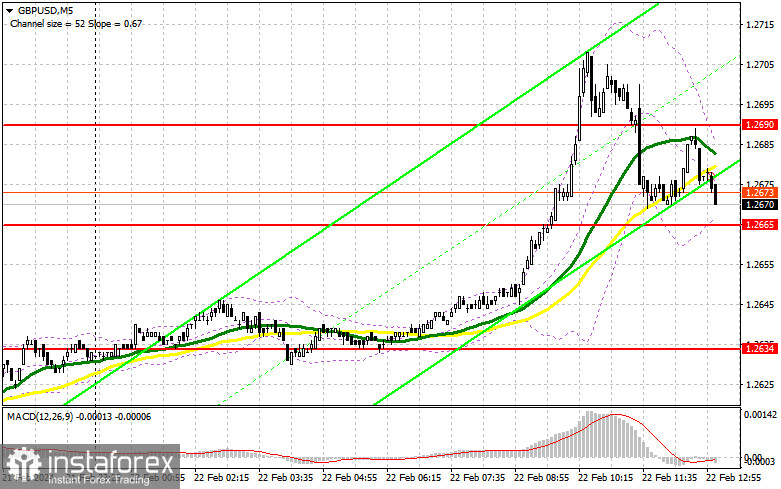
In my morning forecast, I drew attention to the level of 1.2665 and planned to make decisions on market entry based on it. Let's take a look at the 5-minute chart and analyze what happened there. The breakthrough of 1.2665 occurred, but I never waited for a bottom-up retest, so suitable entry points into the market were not obtained. For the second half of the day, the technical picture was revised.
To open long positions on GBP/USD, it is required:
Strong PMI data allowed for maintaining the upward potential of the pound in the first half of the day. Now everything depends on the US reports. Strong data on the Manufacturing Purchasing Managers' Index, the Services Purchasing Managers' Index, and the Composite PMI for the US will put pressure on the pair, as well as a decrease in the number of initial jobless claims and a sharp increase in the volume of home sales in the secondary market in the US. I propose to use this for pound purchases further along the trend. I plan to look for entry points into long positions on declines to around 1.2662 – the new support formed at the end of today. Only the formation of a false breakout there, along with soft statements by FOMC representatives, will provide a suitable entry point for buying with the expectation of the pair's recovery to around 1.2699 – also a new resistance. A breakthrough and consolidation above this range will strengthen demand for the pound and open the way to 1.2730. The ultimate target will be a maximum of 1.2769, where I intend to make a profit. In the scenario of a pair's decline and no activity from the bulls at 1.2662 in the second half of the day, the pound may face selling pressure, canceling all buyer plans for further intraday growth. In this case, only a false breakout in the area of the next support at 1.2634 will confirm the correct entry point into the market. I plan to buy GBP/USD immediately on the rebound from the minimum of 1.2604, with the goal of a correction within the day of 30-35 points.
To open short positions on GBP/USD, the following is required:
In case of weak data and an increase in the pair, I plan to act only after the formation of a false breakout in the area of the new resistance at 1.2699, which will allow me to confirm the presence of large players in the market and will lead to my opening short positions with the target of a decline to around 1.2662, where I expect active buyers to appear. The breakthrough of this level is very important, and if it occurs during the release of US reports or the statements of American politicians, a bottom-up retest of this range will confirm the correct entry for selling the pound, leading to the removal of stop orders and opening the way to 1.2634, where the moving averages are located, playing on the side of buyers. The ultimate target will be the area of 1.2604, where I will make a profit. In the case of an upward movement of GBP/USD and no activity at 1.2699 in the second half of the day, buyers will continue to push the pound upward. In this case, I will postpone the sales until the false breakout at the level of 1.2730. If there is no downward movement there, I will sell GBP/USD immediately on the rebound from 1.2769, but I am only expecting a pair correction down by 30-35 points within the day.
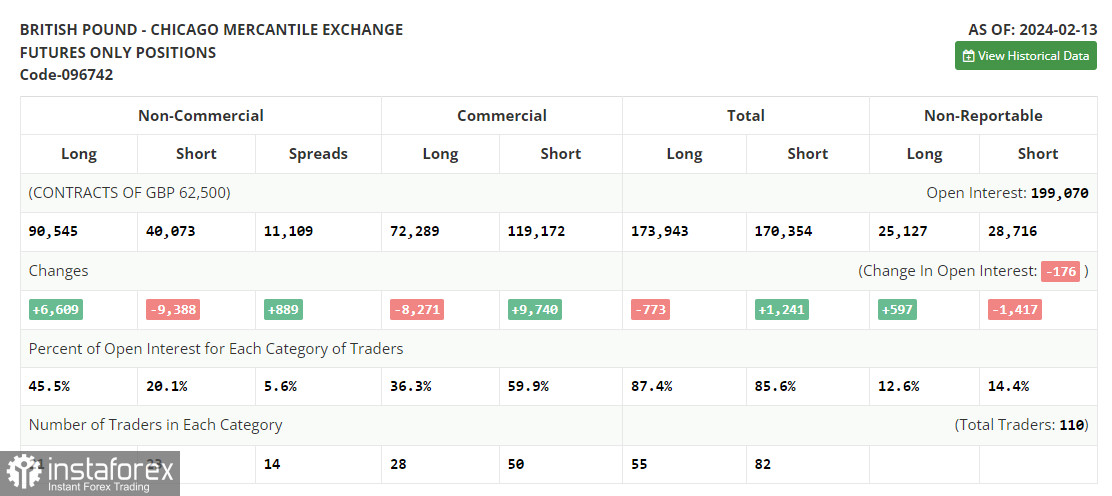
In the COT report (Commitment of Traders) for February 13, there was an increase in long positions and a decrease in short positions, indicating the preservation of market balance after a series of fundamental data indicating the challenges that the Bank of England will have to face. We are talking about high inflation and the weak UK economy, which is on the brink of recession. A lot now depends on the further position of the Bank of England representatives, so pay special attention to their statements. The latest COT report states that non-commercial long positions increased by 6,609 to 90,545, while non-commercial short positions decreased by 9,388 to 40,073. As a result, the spread between long and short positions increased by 889.
Indicator signals:
Moving Averages
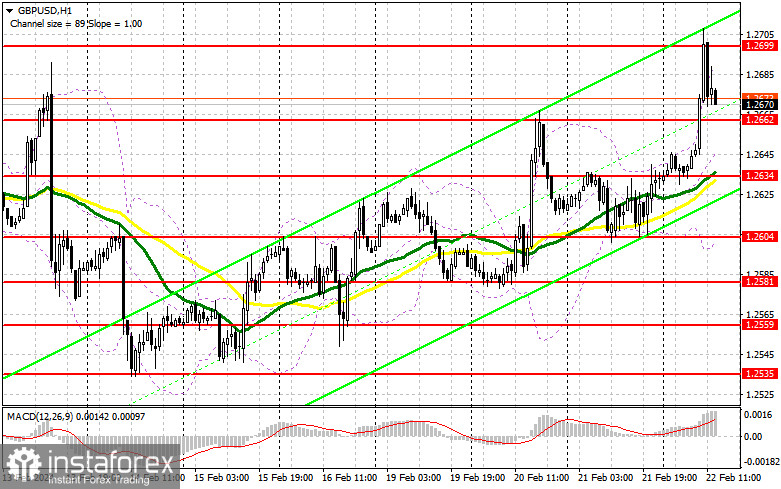
Trading is carried out above the 30 and 50-day moving averages, indicating an attempt to grow the pound.
Note: The author considers the period and prices of moving averages on the hourly chart (H1) and differs from the general definition of classical daily moving averages on the daily chart (D1).
Bollinger Bands
In case of a decline, the lower boundary of the indicator around 1.2635 will act as support.
Description of Indicators:
InstaForex analytical reviews will make you fully aware of market trends! Being an InstaForex client, you are provided with a large number of free services for efficient trading.

