 Stay
Stay 
Trading Conditions
Products
Tools


The wave analysis of the 4-hour chart for the EUR/USD pair remains unchanged. Over the past year, we have seen only three wave structures that constantly alternate with each other. Currently, the construction of another three-wave structure continues – a downtrend, which began on July 18th of the previous year. The assumed wave 1 is complete; wave 2 or b has become more complex three or four times, but is now also complete, as the decline in the pair has been ongoing for over a month
The upward segment of the trend may still resume, but its internal structure will be unreadable in this case. I remind you that I strive to identify unambiguous wave structures that do not tolerate double interpretation. If the current wave analysis is correct, then the market has moved on to form wave 3 or c. Currently, wave 2 in 3 or c is presumably being constructed. If this is indeed the case, then an unsuccessful attempt to break the 61.8% Fibonacci level may indicate the completion of this wave. In any case, the decline in the quotes of the pair should not be completed at this point. Alternatively, the wave analysis may become noticeably more complex.
The decline in the euro looks unconvincing.
The EUR/USD pair practically did not change on Friday with the opening of the American session. For over a week, pair quotes have been balancing between Fibonacci levels of 76.4% and 61.8%, that is, in a narrow sideways corridor. There were not many significant events this week, but the two inflation reports (in Germany and the European Union) could have caused a more pronounced market reaction. I want to remind you that German inflation slowed down more than the market expected, bringing the ECB closer to lowering rates. And today it became known that European inflation slowed down in February to 2.6%, although the market expected a decrease to 2.5%.
Honestly, the inflation indicator for February in the EU is strange. It cannot be interpreted unambiguously. On the one hand, inflation has slowed down again, and there is only a 0.6% gap to the target level. On the other hand, it cannot be certain that the downward trajectory will be maintained. I think that precisely because of the ambiguity, the market did not react to this undoubtedly important report.
Now we should expect new comments from ECB policymakers regarding the need for additional evidence of inflation falling to 2%. Most likely, the Governing Council will decide to wait another month or two to see new consumer price data. If inflation continues to decline, the ECB may start easing monetary policy as early as the beginning of the summer. In my opinion, this will bring the market closer to a reduced demand for the euro. Although, according to wave analysis, it should be declining already. Today in the USA, two more reports will be released, which I am interested in, but they are unlikely to have a significant impact on market sentiment at the end of the week, as the market has been more resting than trading lately.
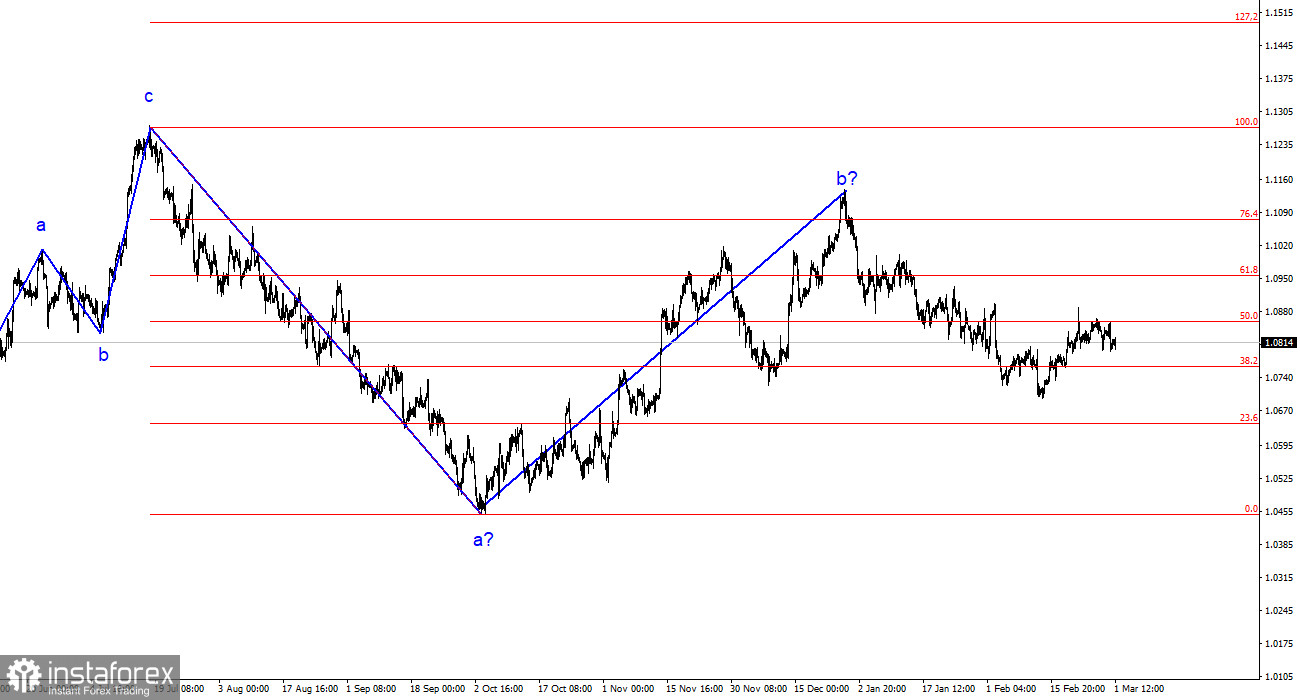
Based on the analysis of the EUR/USD, I conclude that the construction of a bearish set of waves continues. Wave 2 or b has taken on a completed form, so in the near future, I expect the continuation of the construction of an impulsive downtrend wave 3 or c with a significant decline in the pair. Currently, an internal corrective wave is being built, which may have already been completed. I continue to consider only sales with targets near the calculated mark of 1.0462, which corresponds to 127.2% according to Fibonacci.
On the larger wave scale, it can be seen that the assumed wave 2 or b, whose length was more than 61.8% according to Fibonacci from the first wave, may be complete. If this is indeed the case, then the scenario of constructing wave 3 or c and lowering the pair below the 4-figure mark has begun to be implemented.
InstaForex analytical reviews will make you fully aware of market trends! Being an InstaForex client, you are provided with a large number of free services for efficient trading.

