 Stay
Stay 
Trading Conditions
Products
Tools


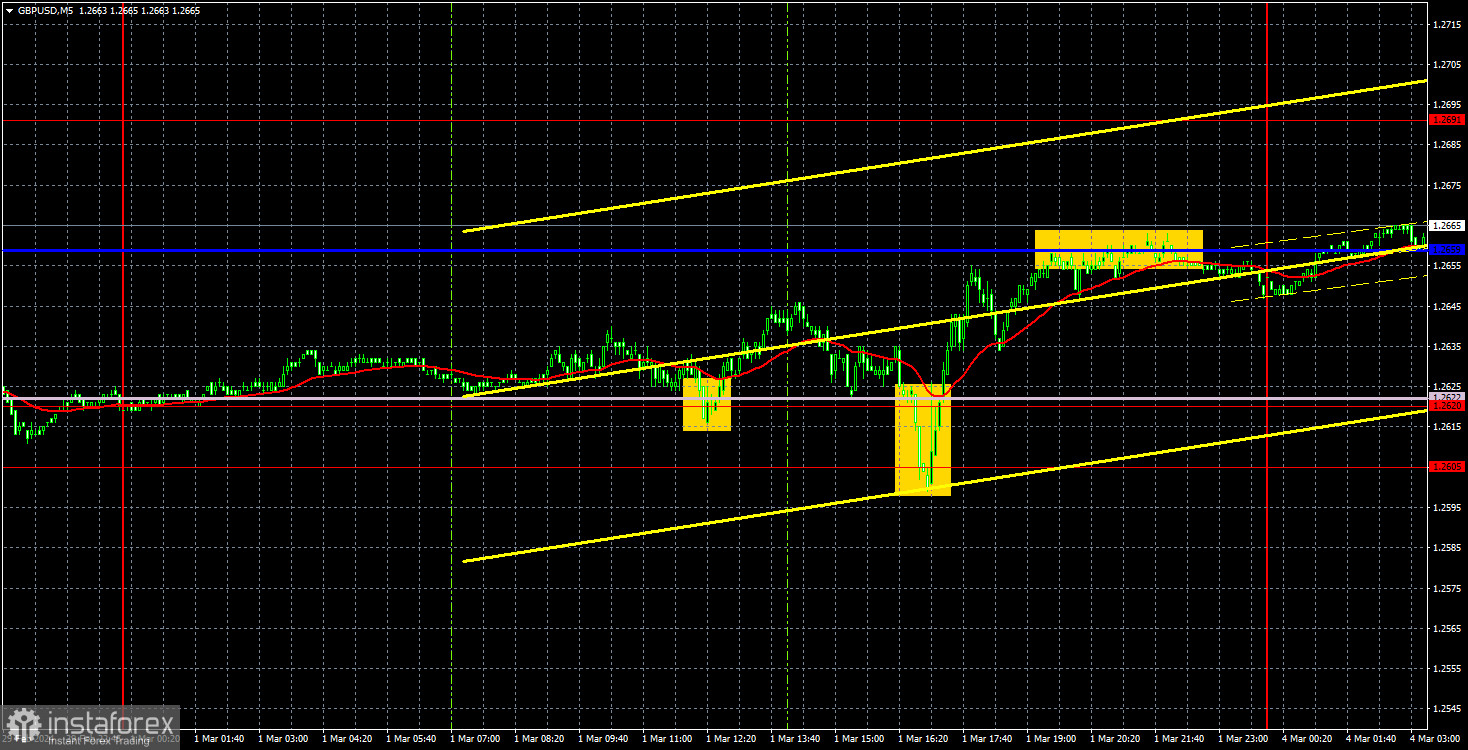
Last Friday, GBP/USD continued to trade in a sideways channel of 1.2620-1.2691. The pair had a chance to consolidate below the area of 1.2605-1.2620, which would've made it possible to form a downtrend. However, the bears failed to overcome this mark once again. In addition, the U.S. data, which were published just when this area was tested, did not support the dollar. There was a bullish rebound, and the pound ended the week where it started.
So what can we say about the technical picture when not only do we have a flat, but a flat within a flat? A flat is clearly visible on the 24-hour timeframe, which has been ongoing for more than 3 months. We can also see a flat on the hourly timeframe, which has been ongoing for 2 weeks. The British pound cannot start a new uptrend or initiate a decline, which would have been much more logical and consistent. In fact, it is simply standing still, and volatility has nearly dropped to the lowest levels. Needless to say, it is quite inconvenient and challenging to trade the pair in the current conditions.
Last week, there was no macroeconomic background in the UK. But even on days when it was present in both the UK and the US, the flat phase was still persistent. There will be important events this week, but again the big question is what kind of movement will they trigger? After all, there were important events a month ago and two months ago, but they did not form a trend. The market will certainly react.
On Friday, the price bounced twice from the area of 1.2605-1.2620, making it possible for traders to open long positions. In the second case, the price even reached the nearest target – the Kijun-sen line. Thus, the first trade closed at breakeven using a Stop Loss, and the second one brought a profit of about 25 pips.
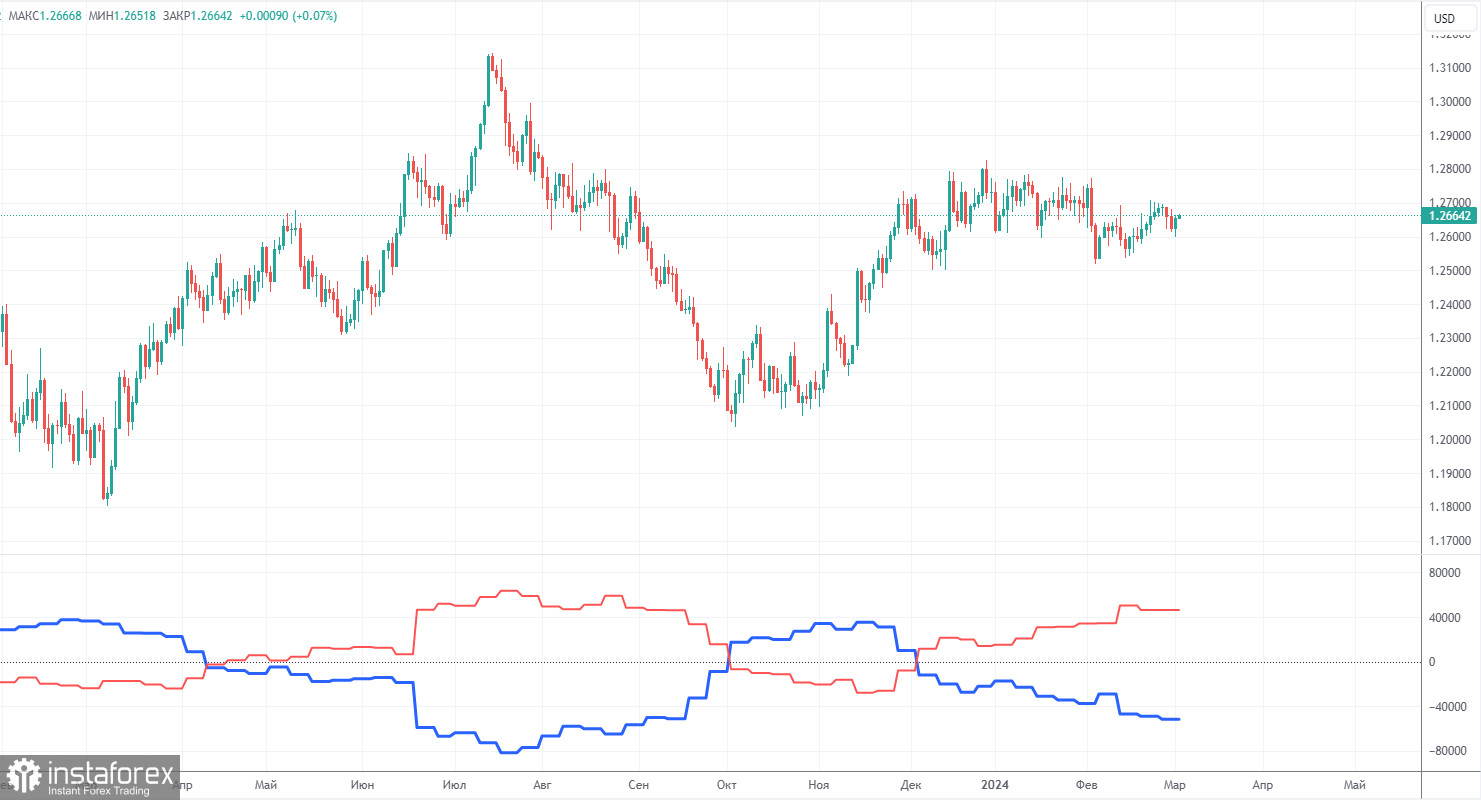
COT reports on the British pound show that the sentiment of commercial traders has frequently changed in recent months. The red and blue lines, which represent the net positions of commercial and non-commercial traders, constantly intersect and, in most cases, remain close to the zero mark. According to the latest report on the British pound, the non-commercial group opened 4,400 buy contracts and 4,300 short ones. As a result, the net position of non-commercial traders increased by 100 contracts in a week. Despite the fact that the net position of speculators is growing, the fundamental background still does not provide a basis for long-term purchases of the pound sterling.
The non-commercial group currently has a total of 92,000 buy contracts and 45,600 sell contracts. The bulls have a big advantage. However, in recent months, we have repeatedly encountered the same situation: the net position either increases or decreases, the bulls or the bears either have the advantage. Since the COT reports do not provide an accurate forecast of the market's behavior at the moment, we have to scrutinize the technical picture and economic reports. The technical analysis suggests that there's a possibility that the pound could show a pronounced downward movement. The economic reports have also been significantly stronger in the United States than in the United Kingdom, but this has not benefited the dollar.
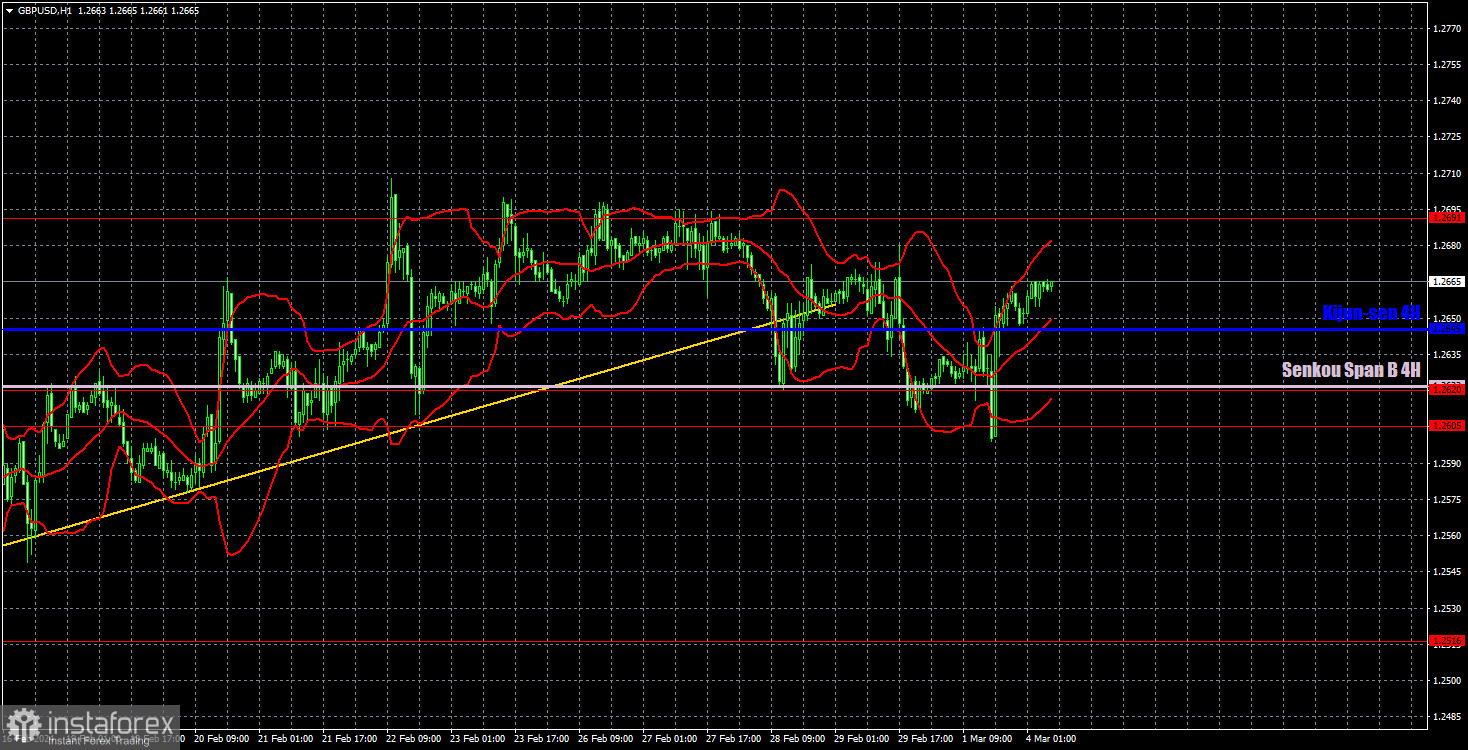
On the 1H chart, GBP/USD left the sideways channel of 1.2611-1.2787 and it still has the potential to form a downtrend. However, we've noticed that the market is not in a rush to sell the pound. The price has been moving sideways (which is clear on the higher timeframes), and market participants feel comfortable in a flat phase. The British pound is still a currency that tends to move sideways, trading in a somewhat illogical and confusing manner. On lower time frames, we regularly observe short-term trends, but it has been quite difficult to make profit from them, as the price constantly changes its direction, and volatility is also low.
As of March 4, we highlight the following important levels: 1.2215, 1.2269, 1.2349, 1.2429-1.2445, 1.2516, 1.2605-1.2620, 1.2691, 1.2786, 1.2863, 1.2981-1.2987. Senkou Span B lines (1.2622) and Kijun-sen (1.2645) can also serve as sources of signals. Don't forget to set a Stop Loss to breakeven if the price has moved in the intended direction by 20 pips. The Ichimoku indicator lines may move during the day, so this should be taken into account when determining trading signals.
On Monday, there are no important events scheduled in the UK and the US. Therefore, it will be extremely difficult to expect strong signals and good trends during the day. Most likely, we are in for another "boring Monday."
Support and resistance levels are thick red lines near which the trend may end. They do not provide trading signals;
The Kijun-sen and Senkou Span B lines are the lines of the Ichimoku indicator, plotted to the 1H timeframe from the 4H one. They provide trading signals;
Extreme levels are thin red lines from which the price bounced earlier. They provide trading signals;
Yellow lines are trend lines, trend channels, and any other technical patterns;
Indicator 1 on the COT charts is the net position size for each category of traders;
Indicator 2 on the COT charts is the net position size for the Non-commercial group.
InstaForex analytical reviews will make you fully aware of market trends! Being an InstaForex client, you are provided with a large number of free services for efficient trading.


