 Stay
Stay 
Trading Conditions
Products
Tools


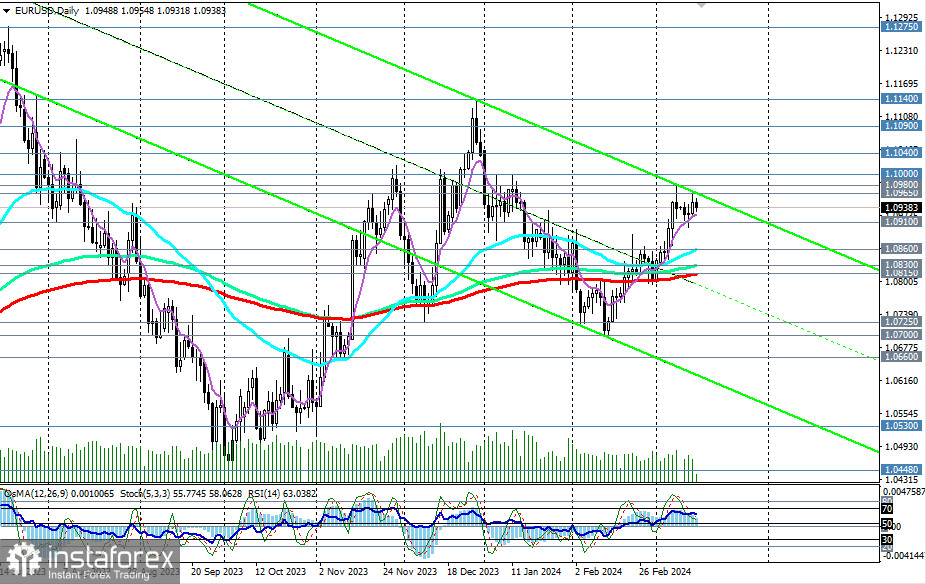
Despite the decline during today's Asian trading session, EUR/USD continues to develop an upward dynamic in the zone of short-term and medium-term bullish markets – above the key support levels 1.0830 (144 EMA on the daily chart), 1.0815 (200 EMA on the daily chart), 1.0800.
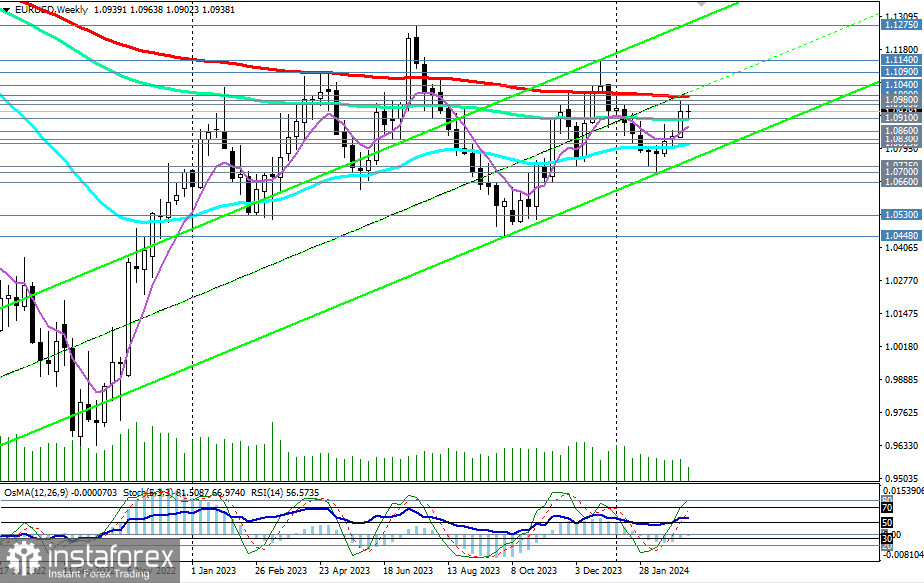
However, for investors to be more confident in maintaining long positions, opening new long positions on the EUR/USD pair, and for its buyers, it is probably worth waiting for the breakthrough of the key resistance at 1.1000 (200 EMA on the weekly chart). The first signals could be the breakthroughs of local resistances at levels 1.0965, 1.0980.
Further growth could lead EUR/USD into the zone of the long-term bullish market, above the key resistance levels 1.1000, 1.1040 (50 EMA on the monthly chart), making medium-term and long-term long positions a priority.
Technical indicators RSI, OsMA, and Stochastic on the daily and weekly charts are also in favor of buyers.
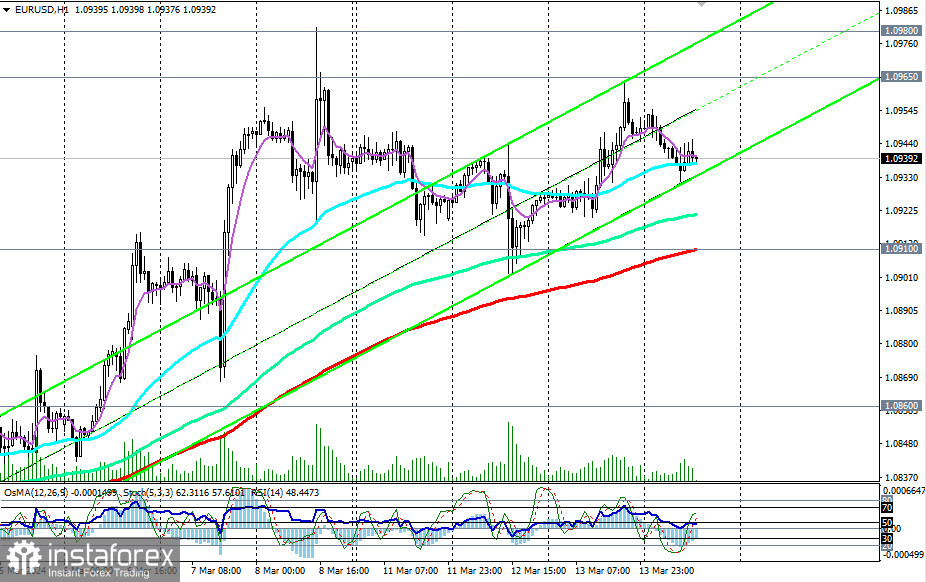
In an alternative scenario, and after breaking below the important support level 1.0910 (144 EMA on the weekly chart and 200 EMA on the 1-hour chart), the decline of EUR/USD may continue down to support levels 1.0860 (50 EMA on the daily chart), 1.0830, 1.0815. Further decline and breakthrough of the level 1.0800 will return EUR/USD to the zone of the medium-term bearish market, making short medium-term positions preferable again. In the long term, below the resistance levels of 1.1000, 1.1040, short positions also remain preferable.
Support levels: 1.0910, 1.0900, 1.0860, 1.0830, 1.0815, 1.0800, 1.0725, 1.0700, 1.0660, 1.0600, 1.0530, 1.0500, 1.0450, 1.0400, 1.0300
Resistance levels: 1.0965, 1.0980, 1.1000, 1.1040, 1.1090, 1.1100, 1.1140, 1.1200, 1.1275, 1.1300, 1.1400, 1.1500, 1.1530, 1.1600, 1.1630
Trading scenarios:
Alternative scenario: Sell Stop 1.0890. Stop-Loss 1.0970. Targets 1.0860, 1.0830, 1.0815, 1.0800, 1.0725, 1.0700, 1.0660, 1.0600, 1.0530, 1.0500, 1.0450, 1.0400, 1.0300
Main scenario: Buy Stop 1.0970. Stop-Loss 1.0890. Targets 1.0980, 1.1000, 1.1040, 1.1090, 1.1100, 1.1140, 1.1200, 1.1275, 1.1300, 1.1400, 1.1500, 1.1530, 1.1600, 1.1630
"Targets" correspond to support/resistance levels. This also does not mean that they will necessarily be reached, but they can serve as a guide when planning and placing trading positions.
InstaForex analytical reviews will make you fully aware of market trends! Being an InstaForex client, you are provided with a large number of free services for efficient trading.


