 Stay
Stay 
Trading Conditions
Products
Tools


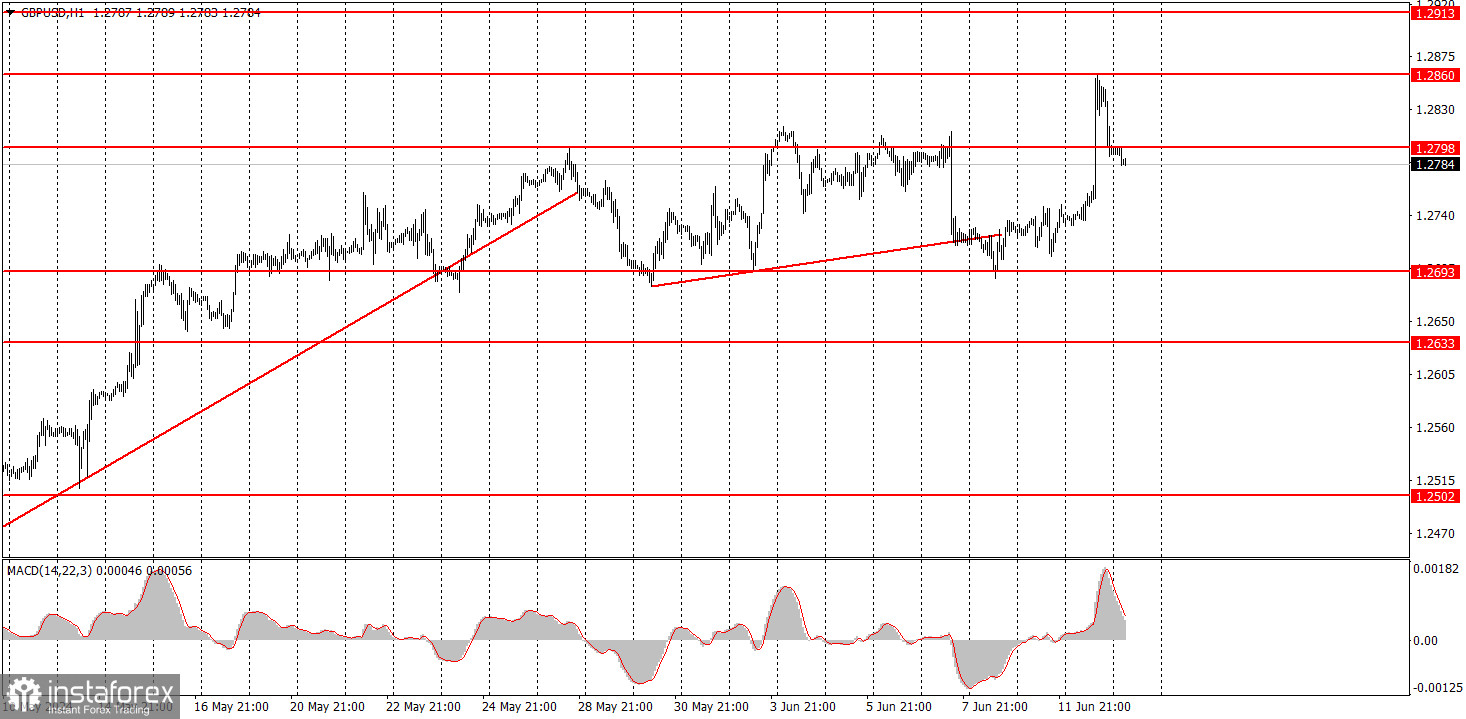
GBP/USD was up significantly on Wednesday. For the fifth or sixth time, the pair failed to surpass the level of 1.2603 to initiate a correction. However, when the US inflation report was released, which cannot be considered "resonant," the market immediately started a USD sell-off. In the evening when Federal Reserve Chair Jerome Powell spoke, the market did not have a strong reaction to this event. Powell explained why the Fed isn't ready to cut rates, but mentioned that the last two inflation reports have been encouraging. Overall, the conclusion could be drawn as follows: the Fed still wants to start lowering rates, but lacks the ability to do so. It is unknown when this opportunity will arise. Maybe if inflation slows at a pace of 0.1% per month, and not every month, and the current inflation rate is one and a half times above the target. Nonetheless, the pound continues to rise on any formal pretext. The market continues to show a strong reaction to all the negative news for the dollar, while it ignores the positive news that can support the US currency.
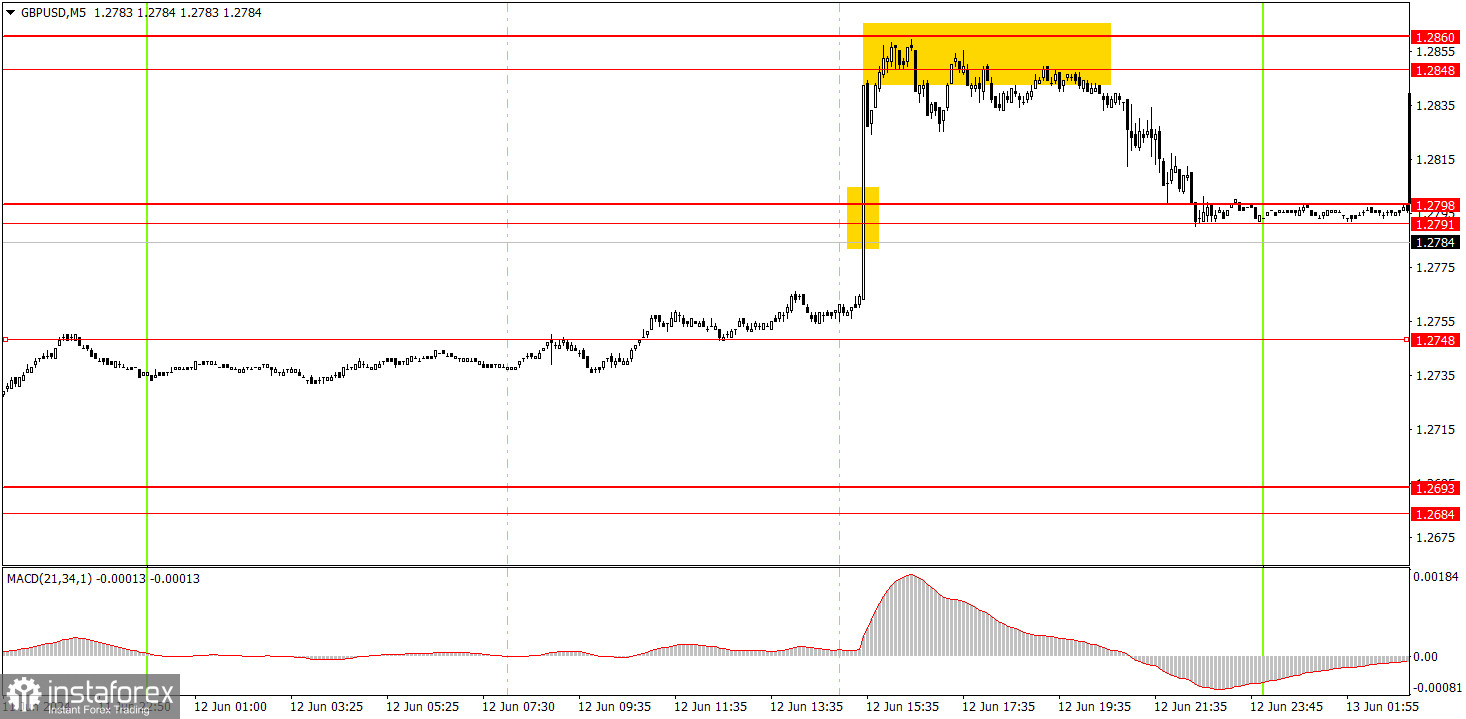
On the 5-minute timeframe, the first signal formed at the intersection of the 1.2791-1.2798 range. There was no opportunity to capitalize on this buy signal as the price surged after the inflation report. However, traders could open short positions using several bounces from the 1.2848-1.2860 area. The price reached the nearest target of 1.2791-1.2798. If the pair consolidates below this area, traders may consider trading bearish today.
On the hourly chart, the GBP/USD pair has great prospects for forming a downward trend, but the bullish correction remains intact. The market has finally considered the strong US data, but this could well be a one-off case. This week, the pound did not fall despite breaking the trend line, despite weak UK data, and despite the Fed's hawkish policy.
For Thursday, we would advise you to expect the pound to fall, since the price has breached the range of 1.2791-1.2798. Consolidation above this area would allow the pound to return to 1.2848-1.2860.
The key levels on the 5M chart are 1.2457, 1.2502, 1.2541-1.2547, 1.2605-1.2633, 1.2684-1.2693, 1.2748, 1.2791-1.2798, 1.2848-1.2860, 1.2913, 1.2980. Today, there are no significant events scheduled in the UK. The US docket will feature two secondary reports on initial jobless claims and Producer Price Index.
1) Signal strength is determined by the time taken for its formation (either a bounce or level breach). A shorter formation time indicates a stronger signal.
2) If two or more trades around a certain level are initiated based on false signals, subsequent signals from that level should be disregarded.
3) In a flat market, any currency pair can produce multiple false signals or none at all. In any case, the flat trend is not the best condition for trading.
4) Trading activities are confined between the onset of the European session and mid-way through the U.S. session, after which all open trades should be manually closed.
5) On the 30-minute timeframe, trades based on MACD signals are only advisable amidst substantial volatility and an established trend, confirmed either by a trendline or trend channel.
6) If two levels lie closely together (ranging from 5 to 15 pips apart), they should be considered as a support or resistance zone.
Support and Resistance price levels can serve as targets when buying or selling. You can place Take Profit levels near them.
Red lines represent channels or trend lines, depicting the current market trend and indicating the preferable trading direction.
The MACD(14,22,3) indicator, encompassing both the histogram and signal line, acts as an auxiliary tool and can also be used as a signal source.
Significant speeches and reports (always noted in the news calendar) can profoundly influence the price dynamics. Hence, trading during their release calls for heightened caution. It may be reasonable to exit the market to prevent abrupt price reversals against the prevailing trend.
Beginners should always remember that not every trade will yield profit. Establishing a clear strategy coupled with sound money management is the cornerstone of sustained trading success.
InstaForex analytical reviews will make you fully aware of market trends! Being an InstaForex client, you are provided with a large number of free services for efficient trading.


