 Stay
Stay 
Trading Conditions
Products
Tools


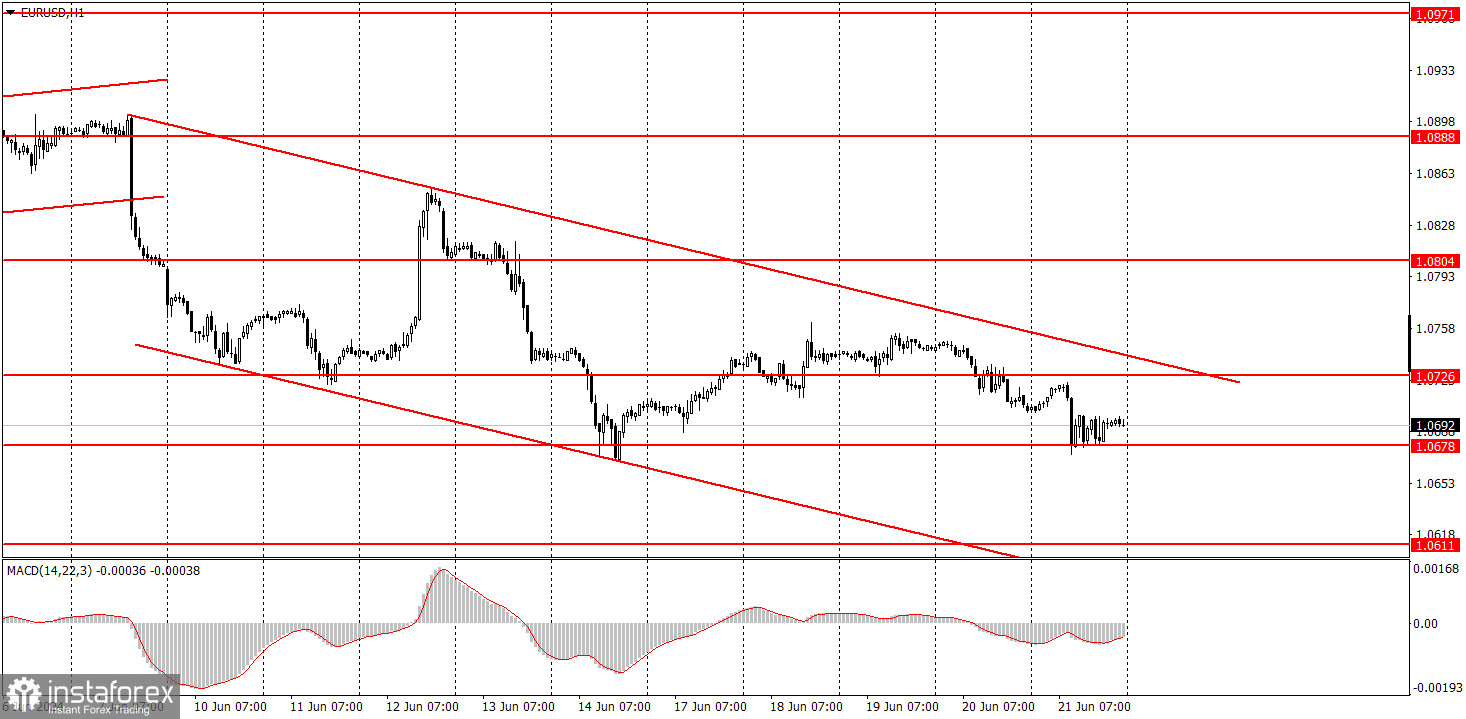
EUR/USD continued to gradually decline within a descending channel on Friday. We fully support the downward movement, as we believe that the euro has no grounds to show a strong rise. Moreover, the pair has been correcting upwards for two months; now, a more significant downward movement should begin within the framework of the global downtrend.
On Friday, business activity indices in the services and manufacturing sectors were published in the European Union and Germany. All four indices turned out to be weaker than forecasts and the previous month's values. Therefore, it's not surprising that the euro fell in the first half of the day. However, in our opinion, the single currency should have been falling even without the help of these reports. In the second half of the day, the US published similar business activity indices, which turned out to be better than the previous month's values. Therefore, the dollar could have strengthened further. However, the price encountered a strong support level at 1.0678, from which it had previously bounced, and this prevented it from falling further.
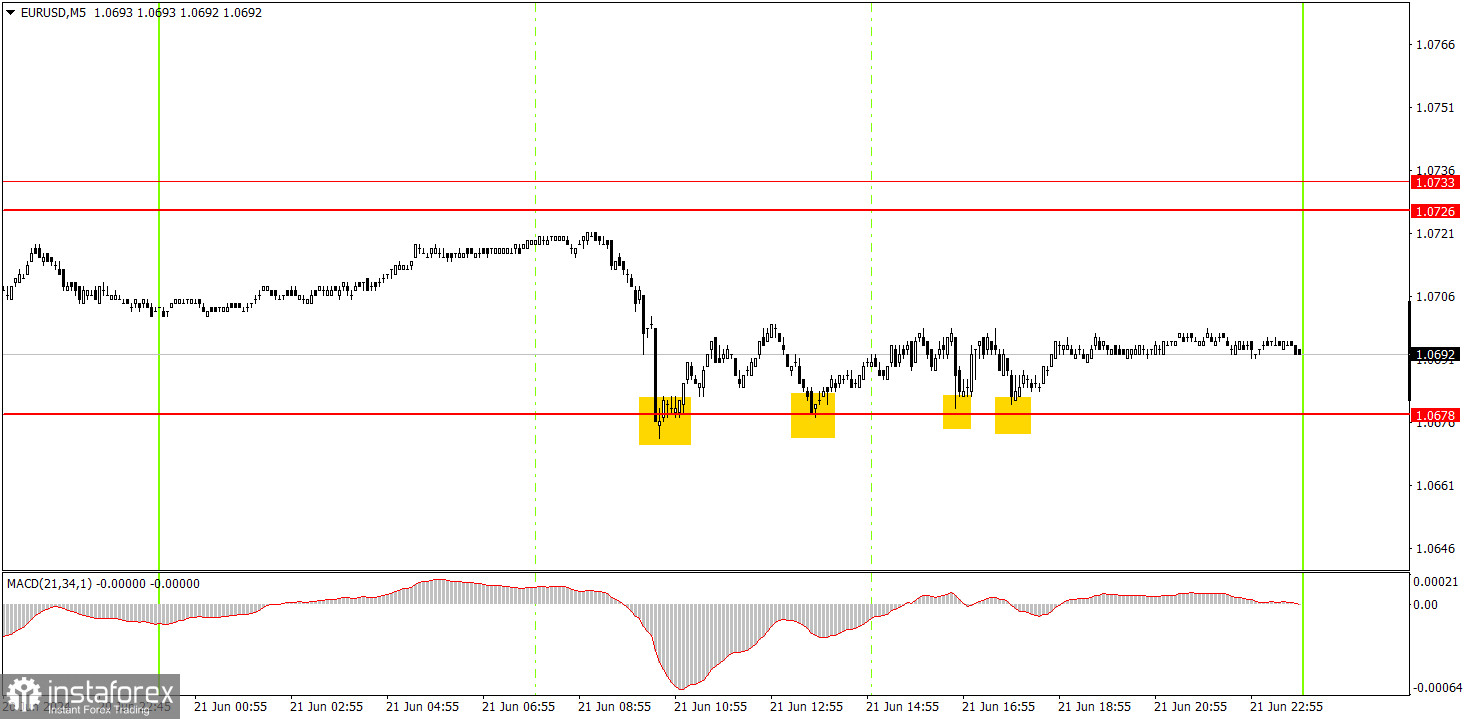
On the 5-minute timeframe, the price bounced four times from the level of 1.0678. That is, four buy signals were generated. The day before, the price formed two sell signals around the 1.0726-1.0733 area. Therefore, traders could hold on to short positions since Thursday. Take note that volatility has been very weak for several months, so if you trade intraday, you should not expect a good profit. In regards to the buy signals on Friday, they all duplicated each other. Therefore, novice traders could only open one long position, so they could earn around 10 pips at best.
On the hourly chart, EUR/USD finally started to form a local downward trend. We still expect the pair to drop to levels of 1.0600, 1.0450, and maybe even 1.0200. However, it's important to understand that the price will not reach these targets immediately; they are medium-term. For instance, the pair could go through a corrective phase for another week, as the pair has not reached the level of 1.0678. We don't see any reasons for the euro to rise in the medium-term.
On Monday, traders can expect a new upward movement, as the level of 1.0678 held up against bearish pressure. However, it's important to remember that the pair may go through significantly low volatility again.
The key levels on the 5M chart are 1.0483, 1.0526, 1.0568, 1.0611, 1.0678, 1.0726-1.0733, 1.0797-1.0804, 1.0838-1.0856, 1.0888-1.0896, 1.0940, 1.0971-1.0981. There are no significant events or reports planned for Monday. We can only highlight the IFO Business Climate Index in Germany, but this is a completely secondary report.
1) Signal strength is determined by the time taken for its formation (either a bounce or level breach). A shorter formation time indicates a stronger signal.
2) If two or more trades around a certain level are initiated based on false signals, subsequent signals from that level should be disregarded.
3) In a flat market, any currency pair can produce multiple false signals or none at all. In any case, the flat trend is not the best condition for trading.
4) Trading activities are confined between the onset of the European session and mid-way through the U.S. session, after which all open trades should be manually closed.
5) On the 30-minute timeframe, trades based on MACD signals are only advisable amidst substantial volatility and an established trend, confirmed either by a trendline or trend channel.
6) If two levels lie closely together (ranging from 5 to 15 pips apart), they should be considered as a support or resistance zone.
Support and Resistance price levels can serve as targets when buying or selling. You can place Take Profit levels near them.
Red lines represent channels or trend lines, depicting the current market trend and indicating the preferable trading direction.
The MACD(14,22,3) indicator, encompassing both the histogram and signal line, acts as an auxiliary tool and can also be used as a signal source.
Significant speeches and reports (always noted in the news calendar) can profoundly influence the price dynamics. Hence, trading during their release calls for heightened caution. It may be reasonable to exit the market to prevent abrupt price reversals against the prevailing trend.
Beginners should always remember that not every trade will yield profit. Establishing a clear strategy coupled with sound money management is the cornerstone of sustained trading success.
InstaForex analytical reviews will make you fully aware of market trends! Being an InstaForex client, you are provided with a large number of free services for efficient trading.


