 Stay
Stay 
Trading Conditions
Products
Tools


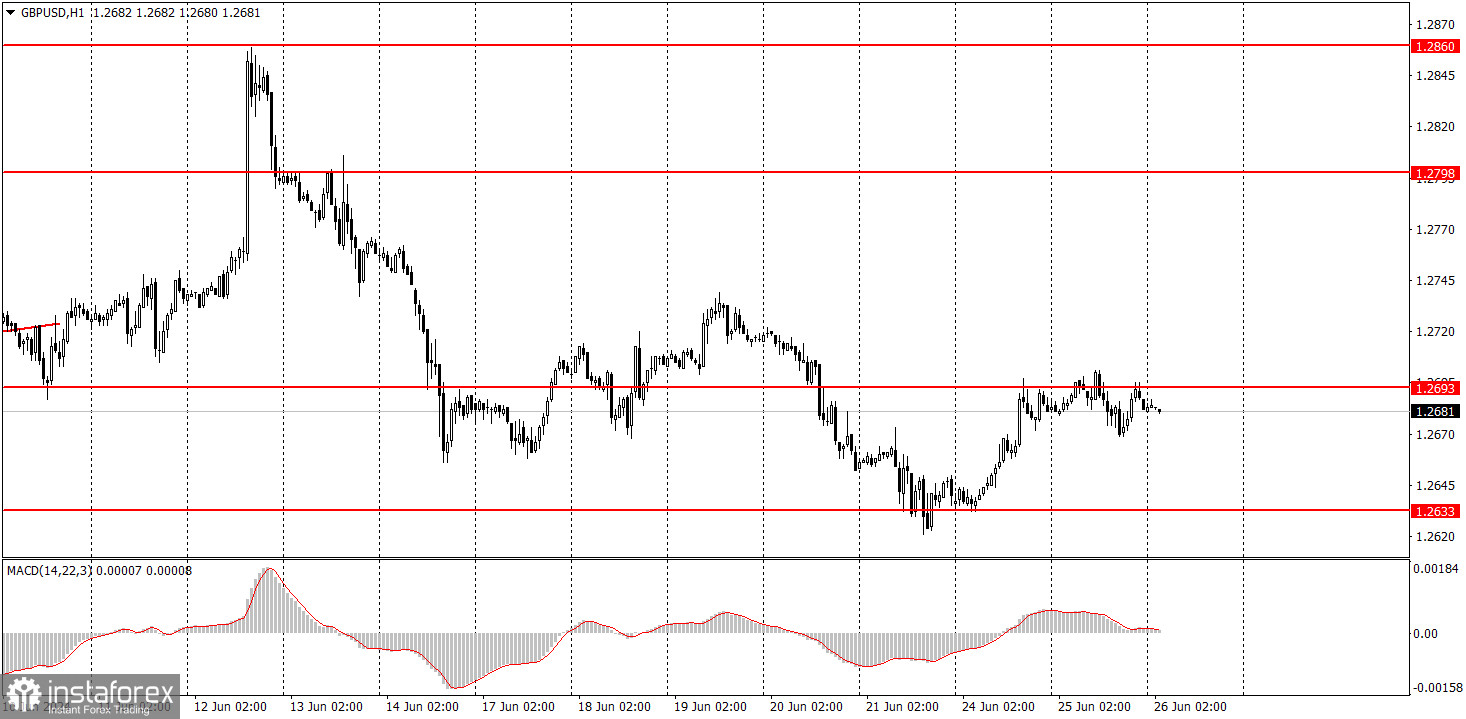
Yesterday, GBP/USD bounced off the 1.2603 level, triggering a minor decline. Unlike the euro, the British pound may resume its downward trend if the market plans to engage in selling. At the very least, the price should drop to the 1.2633 level. However, the pound sterling has been going through low volatility and is reluctant to fall. There were no interesting events in either the UK or the US in the past two days, so there was nothing for the market to react to. We were even surprised by the fairly trend-driven, intraday movement on Monday! But since the price could not overcome the 1.2693 level, we can now expect the pair to decline, especially since there are no significant reports scheduled for Wednesday.
In regards to the pound's medium-term prospects, we still expect a decline. However, the big question remains whether the market is ready to sell the pound. We cannot expect anything else, as we base our conclusions on all major types of analysis, and they all point to a downward direction.
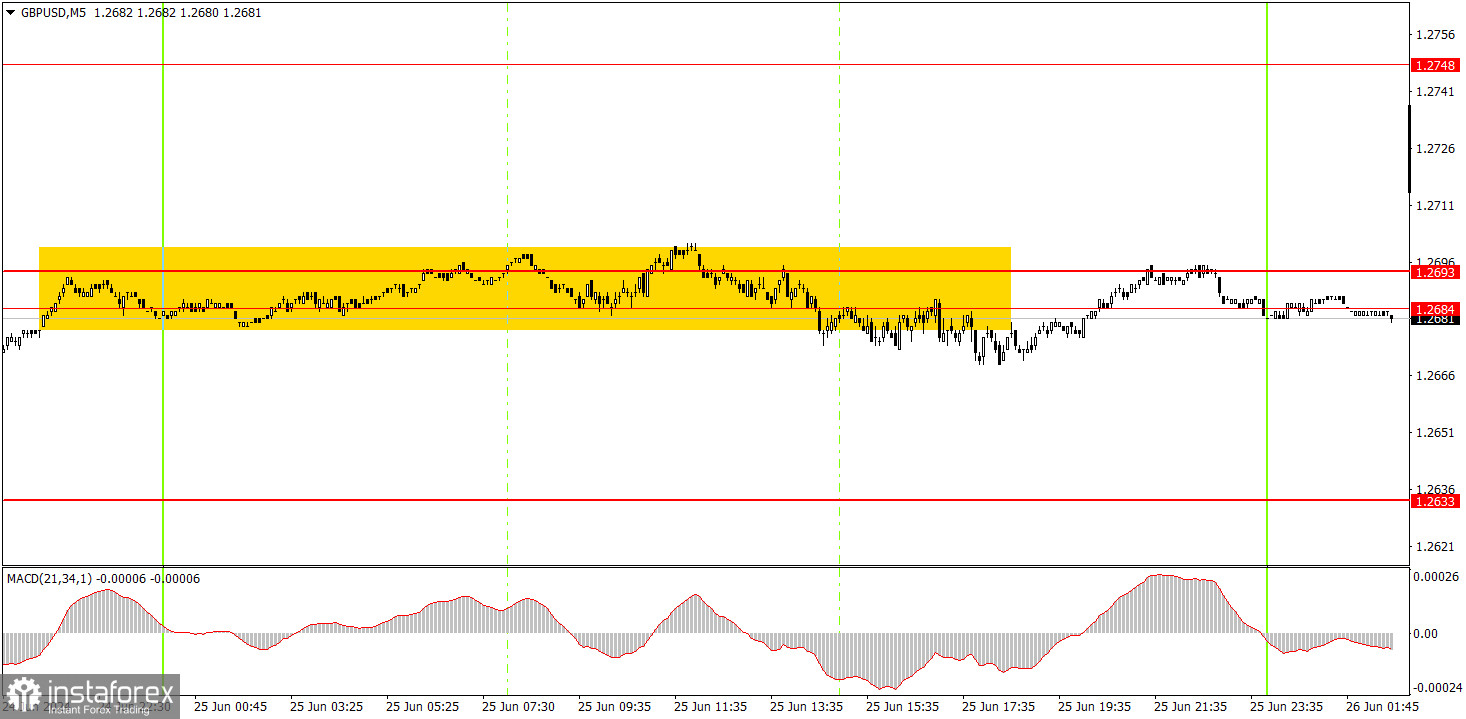
On the 5-minute timeframe, the pair moved sideways for most of the day, right along the 1.2684-1.2693 area. Initial signs of a sell signal started to form during the US trading session when the price consolidated below this area. By then, beginners could already assess the nature of the pair's movement on Tuesday and decide for themselves if they wanted to enter the market with such "brilliant" movements. Nevertheless, traders could sell, and now we can expect the price to fall to the 1.2633 level.
On the hourly chart, the GBP/USD pair continues to show promising signs of forming a downtrend, although the uptrend has not been invalidated. In regards to the pair's bearish prospects, it's a good thing that the price managed to overcome the 1.2693 level twice; However, the market often refuses to sell, even in the presence of technical, fundamental, and macroeconomic factors favoring such a direction.
On Wednesday, the British pound may continue to exhibit erratic and illogical movements. For instance, it can retreat to the 1.2633 level. GBP/USD may go through low volatility.
The key levels on the 5M chart are 1.2457, 1.2502, 1.2541-1.2547, 1.2605-1.2633, 1.2684-1.2693, 1.2748, 1.2791-1.2798, 1.2848-1.2860, 1.2913, and 1.2980. Today, there are no important events scheduled in the UK or the US. Therefore, traders will likely face another boring day.
1) Signal strength is determined by the time taken for its formation (either a bounce or level breach). A shorter formation time indicates a stronger signal.
2) If two or more trades around a certain level are initiated based on false signals, subsequent signals from that level should be disregarded.
3) In a flat market, any currency pair can produce multiple false signals or none at all. In any case, the flat trend is not the best condition for trading.
4) Trading activities are confined between the onset of the European session and mid-way through the U.S. session, after which all open trades should be manually closed.
5) On the 30-minute timeframe, trades based on MACD signals are only advisable amidst substantial volatility and an established trend, confirmed either by a trendline or trend channel.
6) If two levels lie closely together (ranging from 5 to 15 pips apart), they should be considered as a support or resistance zone.
Support and Resistance price levels can serve as targets when buying or selling. You can place Take Profit levels near them.
Red lines represent channels or trend lines, depicting the current market trend and indicating the preferable trading direction.
The MACD(14,22,3) indicator, encompassing both the histogram and signal line, acts as an auxiliary tool and can also be used as a signal source.
Significant speeches and reports (always noted in the news calendar) can profoundly influence the price dynamics. Hence, trading during their release calls for heightened caution. It may be reasonable to exit the market to prevent abrupt price reversals against the prevailing trend.
Beginners should always remember that not every trade will yield profit. Establishing a clear strategy coupled with sound money management is the cornerstone of sustained trading success.
InstaForex analytical reviews will make you fully aware of market trends! Being an InstaForex client, you are provided with a large number of free services for efficient trading.


