 Stay
Stay 
Trading Conditions
Products
Tools


GBP/USD showed quite a strong downward movement on Wednesday, although it had no distinct reason to fall. There was no fundamental or macroeconomic backdrop yesterday. Nevertheless, we completely support the pound's decline under most circumstances, as we firmly believe that its fair value is 500-600 pips lower than the current levels. It remains unclear if the market is ready for such a strong movement, but we can confidently say that buying the British pound has no technical, fundamental, or macroeconomic basis. For nearly six months, most factors imply that GBP/USD should fall.
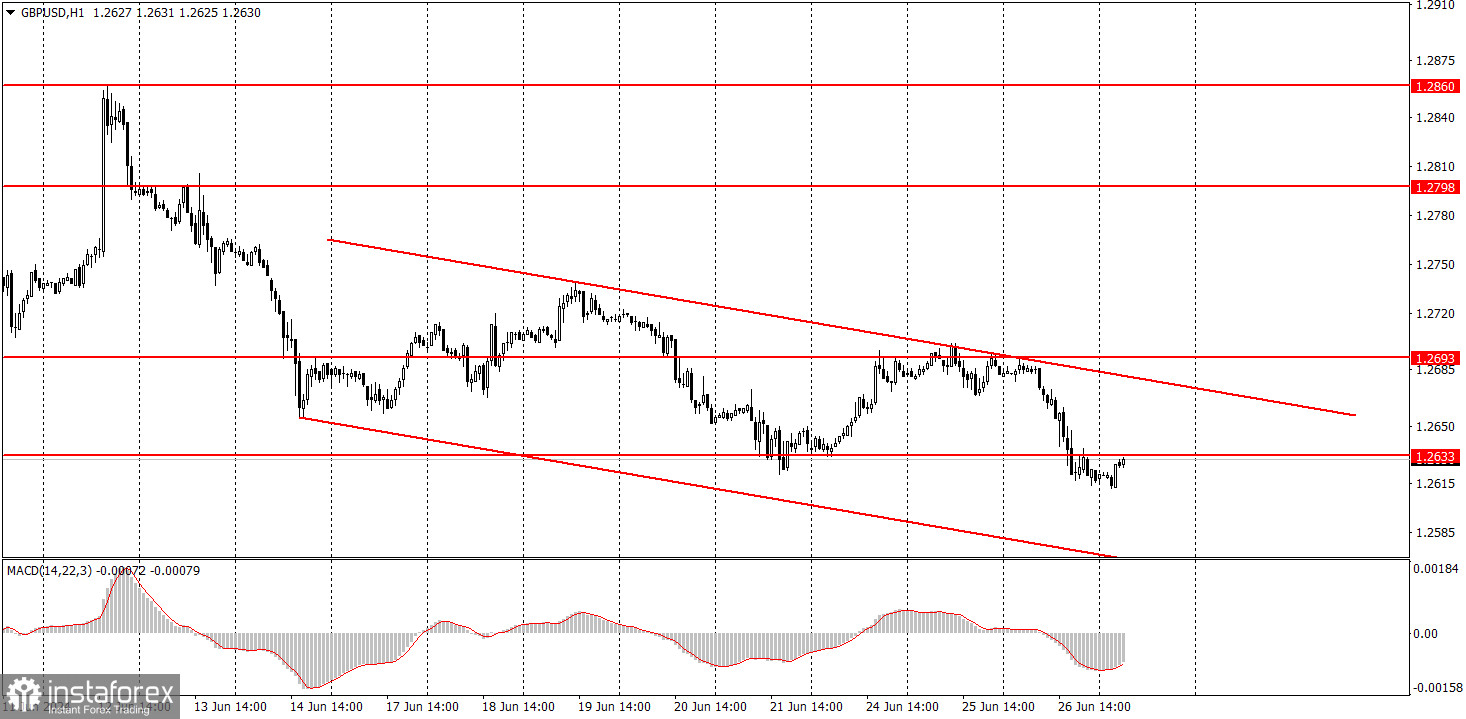
A descending channel has formed on the hourly time frame, which makes the work a bit easier. The pair has a good chance of maintaining the bearish momentum as long as the price remains within this channel. However, be cautious with the pound as it is still reluctant to fall against the dollar. We might be approaching a pivotal moment, but over the past half-year, the market has simply refused to sell the British currency.
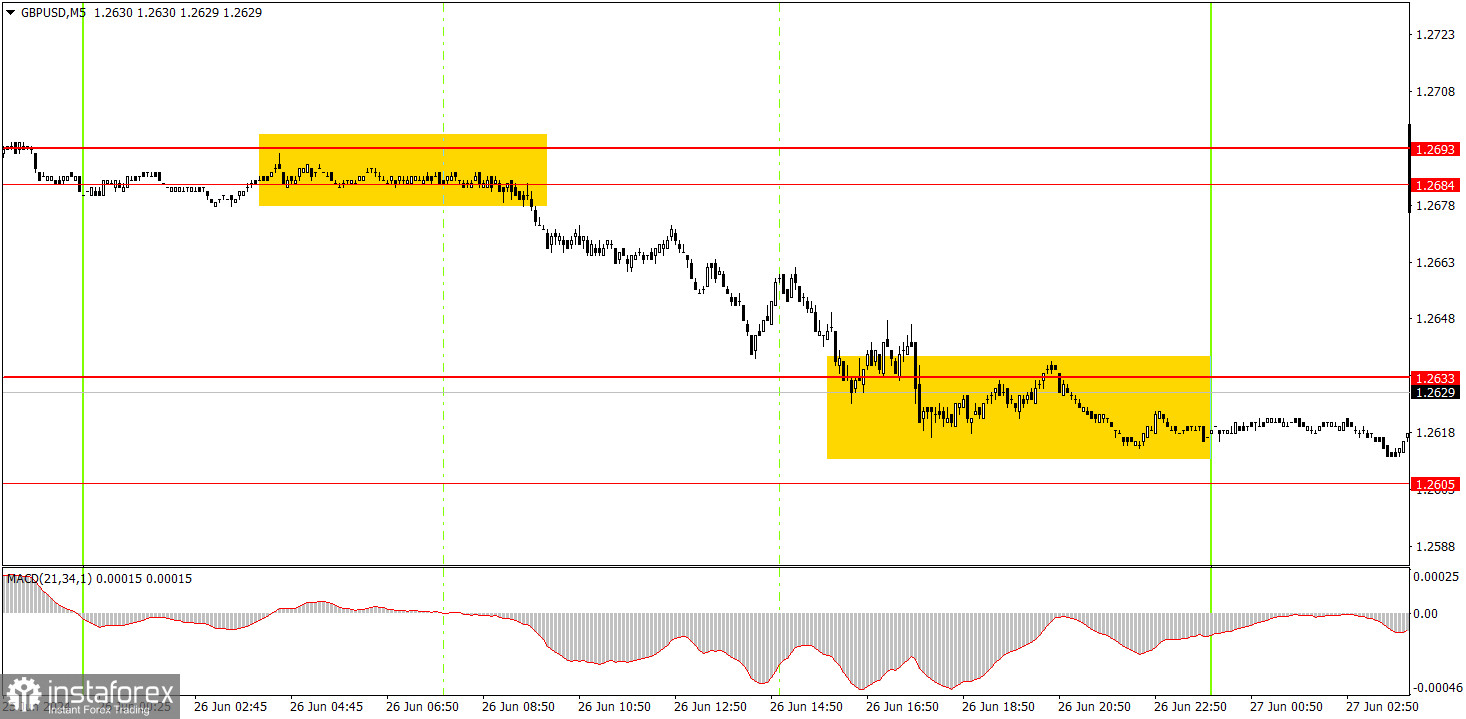
On the 5-minute timeframe, a fairly good sell signal was formed around the 1.2684-1.2693 area. Since the pair managed to maintain a trend for most of the day, the price reached the nearest target area of 1.2605-1.2633. Traders could make approximately 40 pips of profit from the short position. At present, we would advise you to close positions upon reaching the nearest level, as it is quite challenging to expect more than one signal to form during the day.
On the hourly chart, GBP/USD continues to show promising signs of forming a downtrend, although this doesn't mean that the pair can't form an uptrend. In regards to the bearish prospects, it's a good thing that the price managed to overcome the 1.2693 level twice; However, the market often refuses to sell, even in the presence of technical, fundamental, and macroeconomic factors favoring such a direction. Even now, it is clear that each new low is only slightly below the previous one, which shows that the downward trend is weak.
On Thursday, the British pound may continue to exhibit erratic and illogical movements. For instance, it could pull back towards the upper boundary of the descending channel.
The key levels on the 5M chart are 1.2457, 1.2502, 1.2541-1.2547, 1.2605-1.2633, 1.2684-1.2693, 1.2748, 1.2791-1.2798, 1.2848-1.2860, 1.2913, 1.2980. Today, there is nothing to highlight in the UK's economic calendar. The US docket will feature three reports, two of which could influence market sentiment. These reports include GDP and durable goods orders.
1) Signal strength is determined by the time taken for its formation (either a bounce or level breach). A shorter formation time indicates a stronger signal.
2) If two or more trades around a certain level are initiated based on false signals, subsequent signals from that level should be disregarded.
3) In a flat market, any currency pair can produce multiple false signals or none at all. In any case, the flat trend is not the best condition for trading.
4) Trading activities are confined between the onset of the European session and mid-way through the U.S. session, after which all open trades should be manually closed.
5) On the 30-minute timeframe, trades based on MACD signals are only advisable amidst substantial volatility and an established trend, confirmed either by a trendline or trend channel.
6) If two levels lie closely together (ranging from 5 to 15 pips apart), they should be considered as a support or resistance zone.
Support and Resistance price levels can serve as targets when buying or selling. You can place Take Profit levels near them.
Red lines represent channels or trend lines, depicting the current market trend and indicating the preferable trading direction.
The MACD(14,22,3) indicator, encompassing both the histogram and signal line, acts as an auxiliary tool and can also be used as a signal source.
Significant speeches and reports (always noted in the news calendar) can profoundly influence the price dynamics. Hence, trading during their release calls for heightened caution. It may be reasonable to exit the market to prevent abrupt price reversals against the prevailing trend.
Beginners should always remember that not every trade will yield profit. Establishing a clear strategy coupled with sound money management is the cornerstone of sustained trading success.
InstaForex analytical reviews will make you fully aware of market trends! Being an InstaForex client, you are provided with a large number of free services for efficient trading.

