 Stay
Stay 
Trading Conditions
Products
Tools


GBP/USD continued to trade in positive territory on Friday. Almost all of the key reports from the US turned out to be disappointing, so it was absolutely logical for the dollar to fall. However, the market has been selling the dollar for the last 6-9 months, even when there are no grounds for it. For the market, factors like Federal Reserve Chief Jerome Powell's stance, the prolonged hawkish monetary policy of the Fed, or the threat of the Bank of England easing its monetary policy at the next meeting, are no longer as significant as before. Therefore, the dollar drops if there are grounds for it, and it may still fall for no reasons.
Key US economic reports released on Friday disappointed the market. The NonFarm Payrolls rose more than expected by +16,000, but at the same time, the previous month's figure was revised from 272,000 to 218,0000. Thus, the total number of NonFarm Payrolls for the last two months was worse than expected. The unemployment rate also rose to 4.1%, which the market did not anticipate.
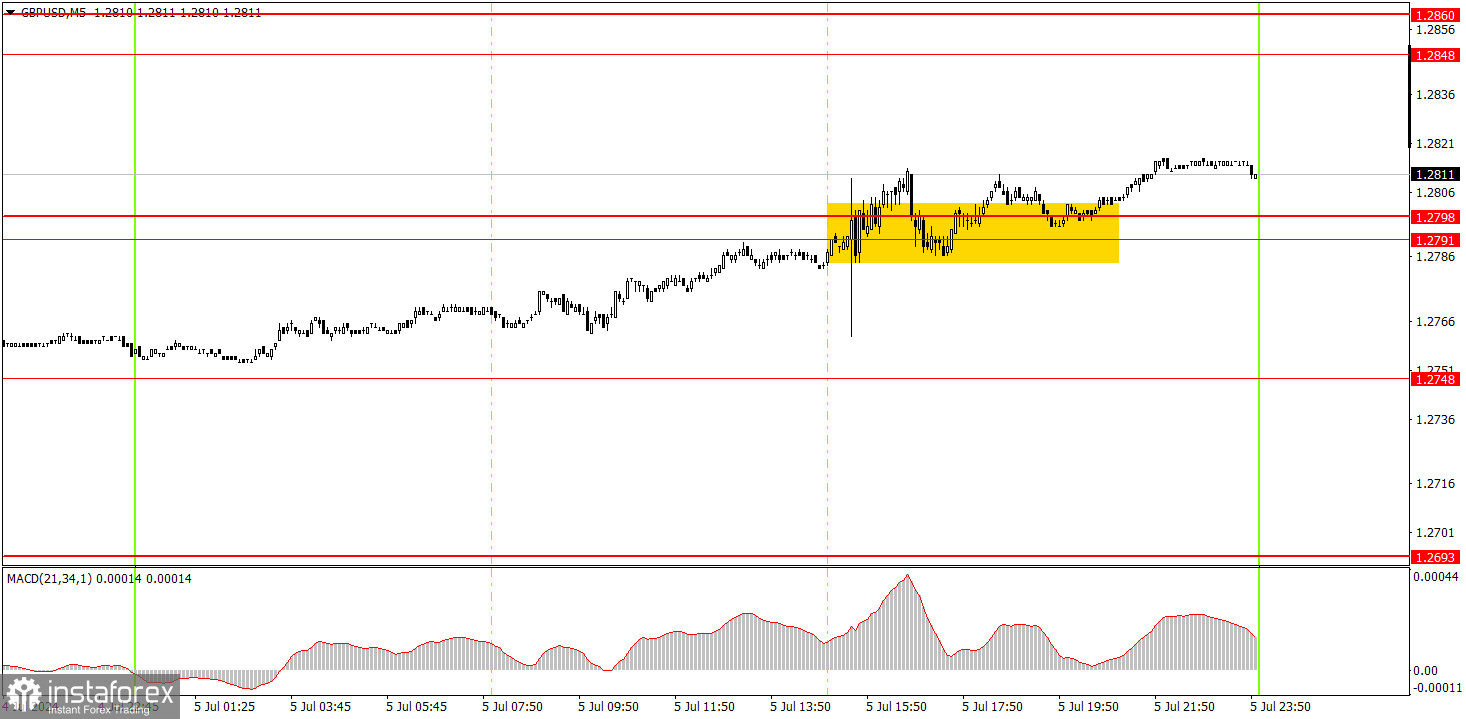
On the 5-minute timeframe, beginners could stay in long positions they opened on Thursday, which was when the pound breached the 1.2748 level. Before the release of US data, the price reached the 1.2791-1.2798 area, where traders could take profit. They could gain about 30 pips. It also made sense to execute the next buy signal by overcoming the 1.2791-1.2798 area, as the nature of the US reports put pressure on the dollar. However, it was necessary for this trade to be kept open for one or two days for traders to make profit.
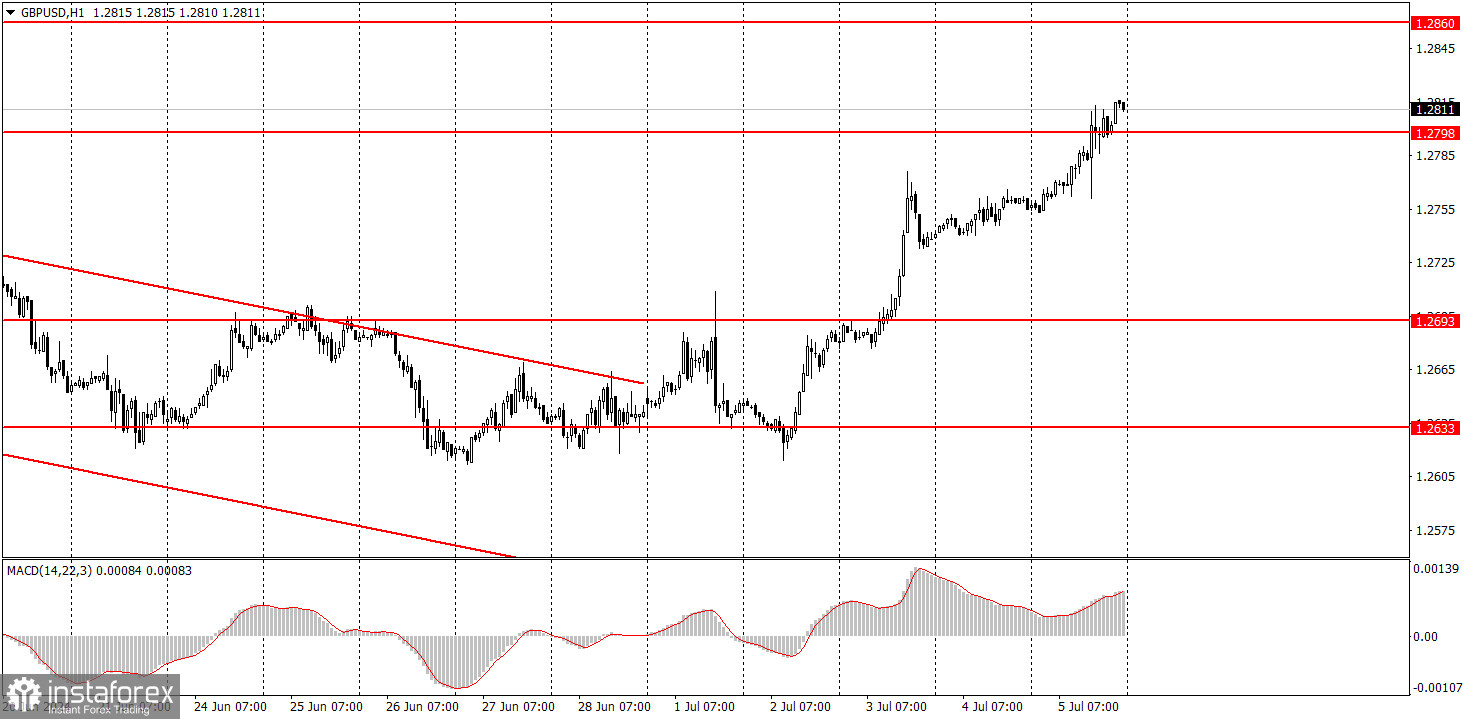
On the hourly chart, GBP/USD continues to show promising signs of forming a downtrend, but this doesn't mean that the pair can't form an upward trend. The pair has been rising again, and overall, it continues to exhibit erratic and illogical movements. Currently, the pound sterling has returned to its latest local high and continues to ignore the fundamental background.
On Monday, the pound sterling may take a break after going through quite a positive week. We can expect a new round of the bearish correction, which can be identified once the price settles below the 1.2798 level.
The key levels on the 5M chart are 1.2457, 1.2502, 1.2541-1.2547, 1.2605-1.2633, 1.2684-1.2693, 1.2748, 1.2791-1.2798, 1.2848-1.2860, 1.2913, 1.2980. On Monday, there are no important events scheduled in the UK and the US. Despite the release of two key reports on Friday, GBP/USD volatility was only around 60 pips. Therefore, we can expect much weaker movements on Monday.
1) Signal strength is determined by the time taken for its formation (either a bounce or level breach). A shorter formation time indicates a stronger signal.
2) If two or more trades around a certain level are initiated based on false signals, subsequent signals from that level should be disregarded.
3) In a flat market, any currency pair can produce multiple false signals or none at all. In any case, the flat trend is not the best condition for trading.
4) Trading activities are confined between the onset of the European session and mid-way through the U.S. session, after which all open trades should be manually closed.
5) On the 30-minute timeframe, trades based on MACD signals are only advisable amidst substantial volatility and an established trend, confirmed either by a trendline or trend channel.
6) If two levels lie closely together (ranging from 5 to 15 pips apart), they should be considered as a support or resistance zone.
Support and Resistance price levels can serve as targets when buying or selling. You can place Take Profit levels near them.
Red lines represent channels or trend lines, depicting the current market trend and indicating the preferable trading direction.
The MACD(14,22,3) indicator, encompassing both the histogram and signal line, acts as an auxiliary tool and can also be used as a signal source.
Significant speeches and reports (always noted in the news calendar) can profoundly influence the price dynamics. Hence, trading during their release calls for heightened caution. It may be reasonable to exit the market to prevent abrupt price reversals against the prevailing trend.
Beginners should always remember that not every trade will yield profit. Establishing a clear strategy coupled with sound money management is the cornerstone of sustained trading success.
InstaForex analytical reviews will make you fully aware of market trends! Being an InstaForex client, you are provided with a large number of free services for efficient trading.


