 Stay
Stay 
Trading Conditions
Products
Tools


GBP/USD continued to trade higher on Wednesday as if nothing had happened. The British pound continues to show mostly illogical movements. It was logical for the dollar to drop last week, but why does it continue to fall this week? However, we have repeatedly been saying for 6 months that no one can explain why the pound continues to rise. Despite the fact that the Bank of England may start lowering rates at the next meeting and inflation in the UK has dropped to 2%, the market only sees the slowdown of inflation in the US (which actually isn't happening) and continues to dream of a Federal Reserve rate cut. And not just dream, but they actually believe in it! Therefore, the pound can continue to rise for as long as it wants, as it doesn't need any grounds for growth. Yesterday, Fed Chief Jerome Powell delivered the second semi-annual testimony before the US Congress, but it clearly did not provoke the dollar's fall, as the EUR/USD pair would have also shown growth if that was the case.
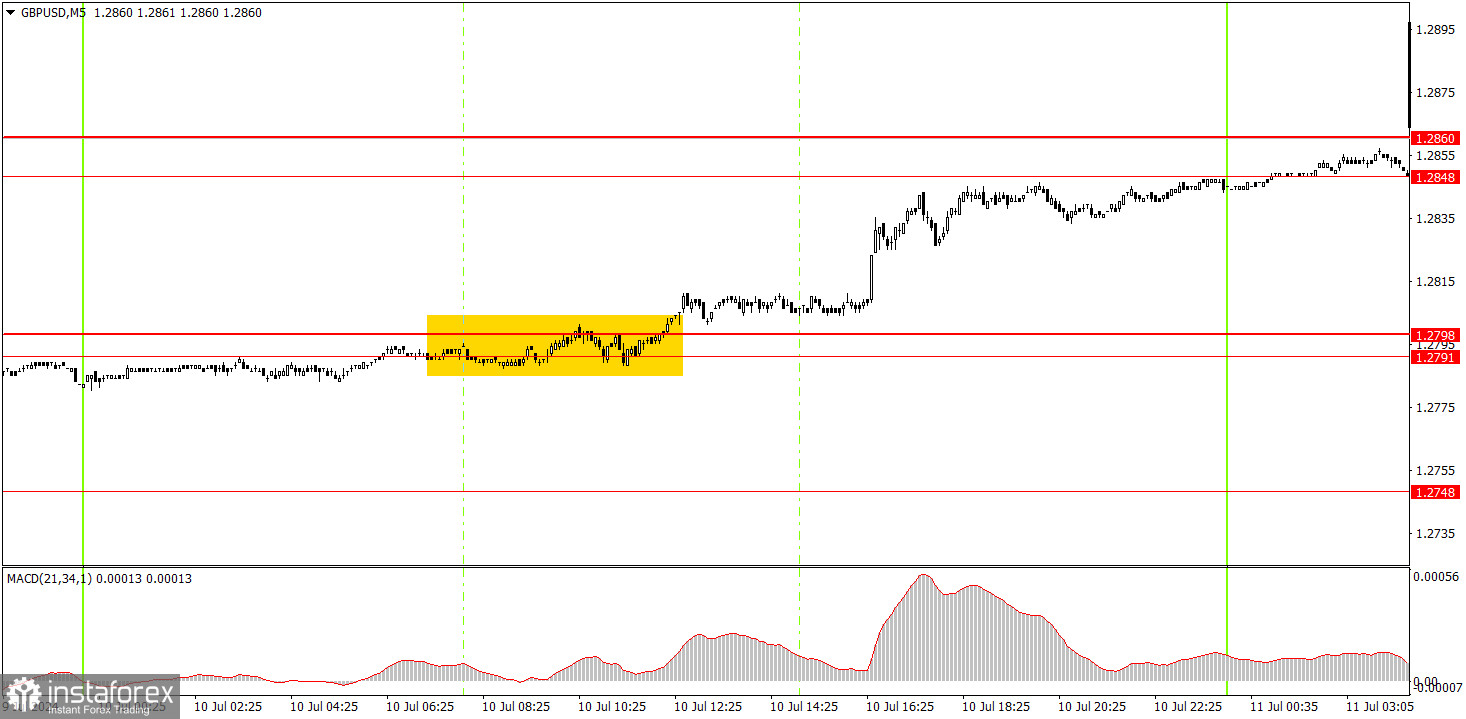
Only one trading signal was formed on the 5-minute timeframe. During European trading hours, the price broke through the 1.2791-1.2798 area, after which the pound managed to rise to the 1.2848-1.2860 area. Thus, although the movement was illogical, the signal could have been worked out, and it brought a profit of about 35 pips. The rebound from the 1.2848-1.2860 area can be used as a sell signal.
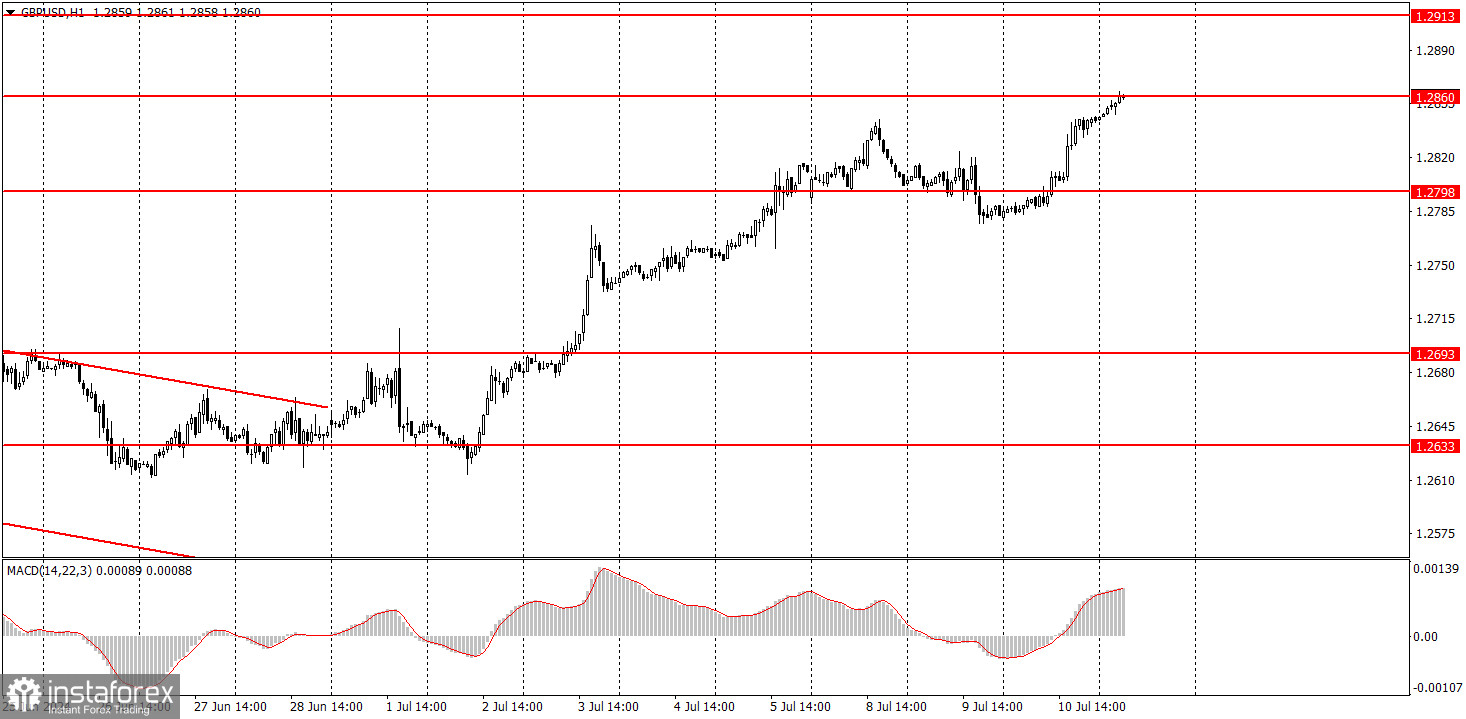
On the hourly chart, GBP/USD continues to show promising signs of forming a downtrend, but this doesn't mean that the pair can't form an upward trend. The pair has been rising again, and overall, it continues to exhibit erratic and illogical movements. Currently, the pound sterling has returned to its recent local high and continues to ignore the fundamental background.
On Thursday, the pound sterling may gradually fall from the 1.2848-1.2860 area. However, a new slowdown in US inflation could provoke the dollar's decline.
The key levels on the 5M chart are 1.2457, 1.2502, 1.2541-1.2547, 1.2605-1.2633, 1.2684-1.2693, 1.2748, 1.2791-1.2798, 1.2848-1.2860, 1.2913, and 1.2980. Today, the UK will release monthly reports on GDP and industrial production, which rarely provoke a strong market reaction. The US inflation report has a much greater chance of provoking a better reaction.
1) Signal strength is determined by the time taken for its formation (either a bounce or level breach). A shorter formation time indicates a stronger signal.
2) If two or more trades around a certain level are initiated based on false signals, subsequent signals from that level should be disregarded.
3) In a flat market, any currency pair can produce multiple false signals or none at all. In any case, the flat trend is not the best condition for trading.
4) Trading activities are confined between the onset of the European session and mid-way through the U.S. session, after which all open trades should be manually closed.
5) On the 30-minute timeframe, trades based on MACD signals are only advisable amidst substantial volatility and an established trend, confirmed either by a trendline or trend channel.
6) If two levels lie closely together (ranging from 5 to 15 pips apart), they should be considered as a support or resistance zone.
Support and Resistance price levels can serve as targets when buying or selling. You can place Take Profit levels near them.
Red lines represent channels or trend lines, depicting the current market trend and indicating the preferable trading direction.
The MACD(14,22,3) indicator, encompassing both the histogram and signal line, acts as an auxiliary tool and can also be used as a signal source.
Significant speeches and reports (always noted in the news calendar) can profoundly influence the price dynamics. Hence, trading during their release calls for heightened caution. It may be reasonable to exit the market to prevent abrupt price reversals against the prevailing trend.
Beginners should always remember that not every trade will yield profit. Establishing a clear strategy coupled with sound money management is the cornerstone of sustained trading success.
InstaForex analytical reviews will make you fully aware of market trends! Being an InstaForex client, you are provided with a large number of free services for efficient trading.


