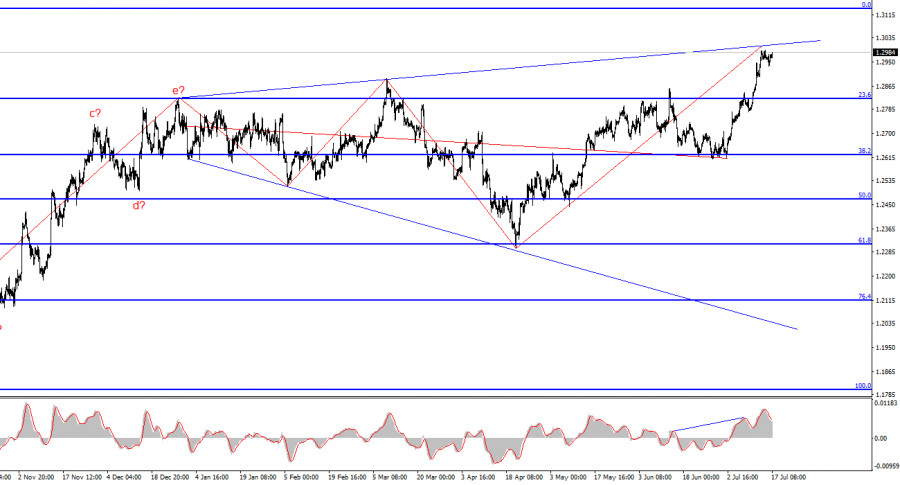
This information is provided to retail and professional clients as part of marketing communication. It does not contain and should not be construed as containing investment advice or investment recommendation or an offer or solicitation to engage in any transaction or strategy in financial instruments. Past performance is not a guarantee or prediction of future performance. Instant Trading EU Ltd. makes no representation and assumes no liability as to the accuracy or completeness of the information provided, or any loss arising from any investment based on analysis, forecast or other information provided by an employee of the Company or otherwise. Full disclaimer is available here.
Popular analytics
The wave structure for GBP/USD remains quite complex and needs to be clarified. Around the 1.2822 mark, which corresponds to 23.6% Fibonacci retracement and is located near the peak.
Trading Signals for GOLD for July 17-20: sell below $2,481 (8/8 Murray - extremely overbought)
According to the eagle indicator, gold is extremely overbought. Therefore, we believe that below 2,481, a strong technical correction could occur with downward targets at 7/8 Murray located at 2,468.
Analysis of EUR/USD pair on July 17, 2024
The wave pattern on the 4-hour chart for the EUR/USD instrument has changed. If we analyze the trend segment that began in September 2022, when the European currency fell.
GBP/USD: Simple trading tips for beginner traders on July 17th (updated forecast)
The test of the 1.2980 price occurred when the MACD indicator was just starting to move up from the zero mark, which confirmed the correct entry point for buying.
XAU/USD. The weakness of the dollar, as well as high geopolitical risks, support the price of gold (we expect the price of the yellow metal to continue to rise)
The price of gold continues to rally on the wave of two main factors – the weakening of the dollar influenced by the market's conviction that the Fed will.
EUR/USD. ECB July meeting: preview
On Thursday, July 18, the European Central Bank will hold its next meeting. The formal outcomes of this meeting are predetermined. However, the ECB may still trigger significant volatility.
Technical Analysis of Intraday Price Movement of Natural Gas Commodity Asset, Tuesday July 17, 2024.
Even though Seller is dominating the Natural Gas commodity asset on the 4-hour chart which is marked by its price movement moving below EMA 20 & EMA 50, however, with.
USD/JPY: trading tips for beginners for the European session on July 17
Overview of trading and tips on USD/JPY The price test of 158.63 occurred when the MACD indicator was just starting to rise from the zero mark, which confirmed a good.
Show more
This section is updated daily and contains market analysis prepared by professional analysts on behalf of InstaForex. Each of the specialists presents analytical reviews in accordance with his/her vision of the current situation on the foreign exchange and other markets. However, the outlooks below are neither recommendations nor instructions to any actions. They contain analysis of the current situation on financial markets. In some cases, analysts' opinions about current market conditions may differ.