 Stay
Stay 
Trading Conditions
Products
Tools


EUR/USD started to correct slightly lower on Thursday. There was at least one important event worth highlighting the European Central Bank meeting. Furthermore, ECB President Christine Lagarde delivered a speech, but the market did not receive any significant information, as we had warned beforehand. The fact is, no one expected the ECB to lower rates in July. This means that there should have been no changes in the monetary policy. The same applied to Lagarde's speech. If policy is unchanged, there is essentially nothing to comment on. Lagarde merely reiterated that the ECB does not have a clear plan for lowering the key rate, so none of her colleagues will make any forecasts regarding the timing of the future rate cut.
However, the market clearly understands that the current inflation figures allow the ECB to lower rates once every two meetings. Therefore, the base scenario is still a rate cut in September. Volatility was extremely low on Thursday, which is no longer surprising. The pair may leave the ascending channel, so the euro may fall somewhat.
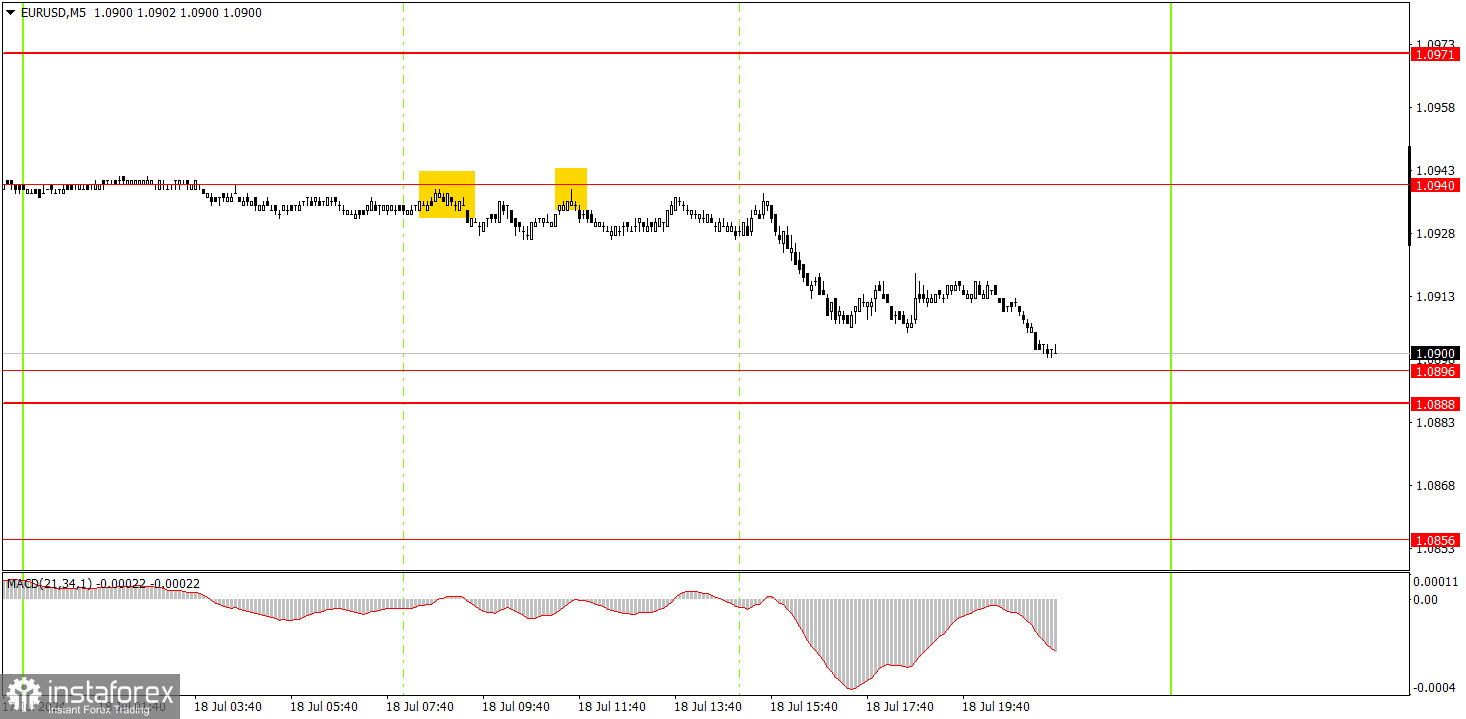
Two sell signals were formed on the 5-minute timeframe. The price bounced off the 1.0940 level twice during the day, so novice traders could open short positions. However, as usual, the price failed to reach the nearest target level of 1.0896. Therefore, it is still too early to draw conclusions about the end of the upward trend.
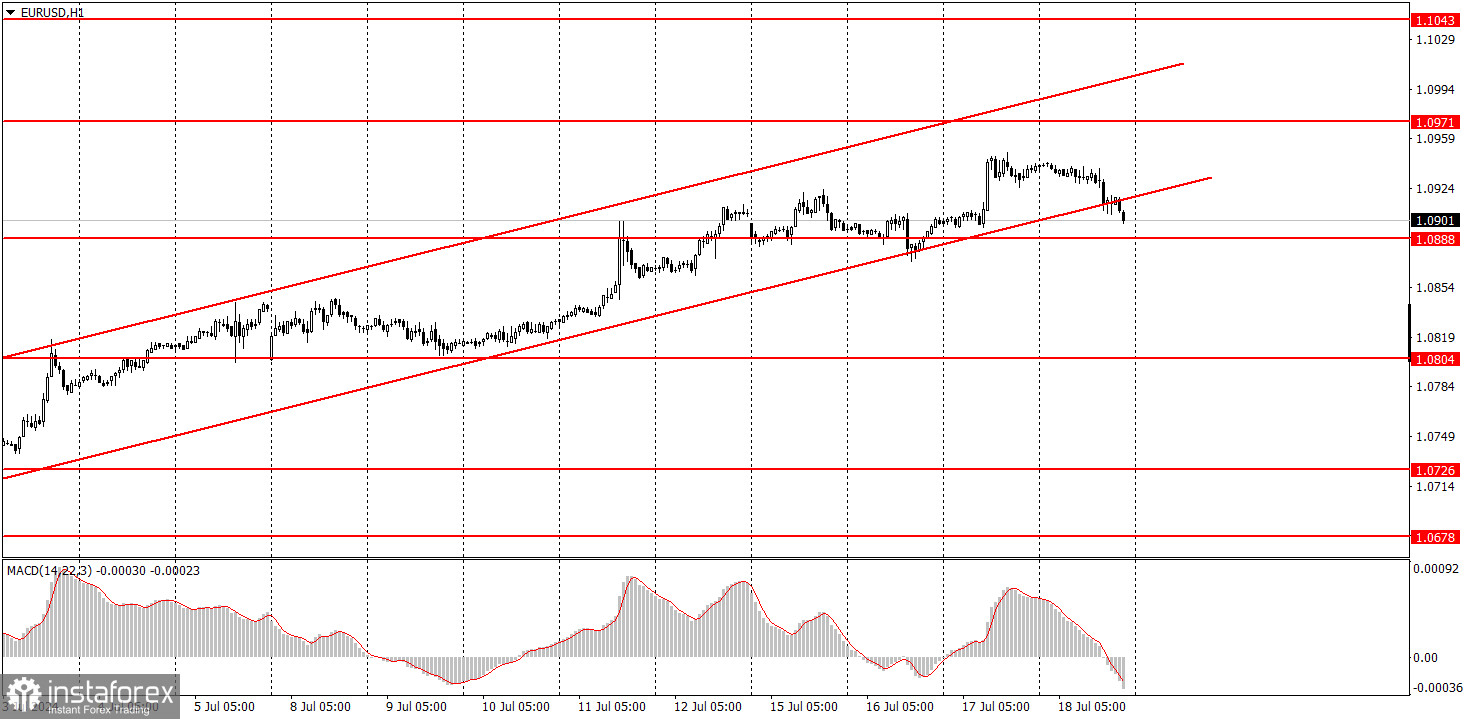
On the hourly chart, EUR/USD continues its local upward trend. Sometimes the market has a reason to buy the pair, and when it doesn't, it just invents its own reasons. The single currency has been firmly rising almost every day. The current movement seems illogical, but from a technical perspective, everything is consistent.
On Friday, novice traders can trade from the level of 1.0888-1.0896 area. There will be no important events again, so strong movements are not expected.
The key levels on the 5M chart are 1.0483, 1.0526, 1.0568, 1.0611, 1.0678, 1.0726-1.0733, 1.0797-1.0804, 1.0838-1.0856, 1.0888-1.0896, 1.0940, 1.0971-1.0981. Today, there are no important events or reports scheduled in either the Eurozone or the US. Therefore, we are likely to see sluggish movements and low volatility once again.
1) Signal strength is determined by the time taken for its formation (either a bounce or level breach). A shorter formation time indicates a stronger signal.
2) If two or more trades around a certain level are initiated based on false signals, subsequent signals from that level should be disregarded.
3) In a flat market, any currency pair can produce multiple false signals or none at all. In any case, the flat trend is not the best condition for trading.
4) Trading activities are confined between the onset of the European session and mid-way through the U.S. session, after which all open trades should be manually closed.
5) On the 30-minute timeframe, trades based on MACD signals are only advisable amidst substantial volatility and an established trend, confirmed either by a trendline or trend channel.
6) If two levels lie closely together (ranging from 5 to 15 pips apart), they should be considered as a support or resistance zone.
Support and Resistance price levels can serve as targets when buying or selling. You can place Take Profit levels near them.
Red lines represent channels or trend lines, depicting the current market trend and indicating the preferable trading direction.
The MACD(14,22,3) indicator, encompassing both the histogram and signal line, acts as an auxiliary tool and can also be used as a signal source.
Significant speeches and reports (always noted in the news calendar) can profoundly influence the price dynamics. Hence, trading during their release calls for heightened caution. It may be reasonable to exit the market to prevent abrupt price reversals against the prevailing trend.
Beginners should always remember that not every trade will yield profit. Establishing a clear strategy coupled with sound money management is the cornerstone of sustained trading success.
InstaForex analytical reviews will make you fully aware of market trends! Being an InstaForex client, you are provided with a large number of free services for efficient trading.

