 Stay
Stay 
Trading Conditions
Products
Tools


The GBP/USD pair also showed quite a decent downward movement on Monday, but by the end of the trading day, it had managed to recover most of its positions. The British pound continues to decline overall, but it is still doing so very slowly. As a reminder, we expect a further decline in the British currency. The Bank of England might start easing monetary policy as early as this Thursday, and the pound has already accounted for all the bullish factors with a significant margin.
On Monday, the calendars for both the UK and the US were empty, yet the market was still actively trading. The presence of numerous important events this week likely played a role. We have the BoE and the Federal Reserve meetings and, at most, significant economic reports from the US. Thus, a further decline in the pound this week is not clear. It will depend on how the market interprets important information over the next four days.
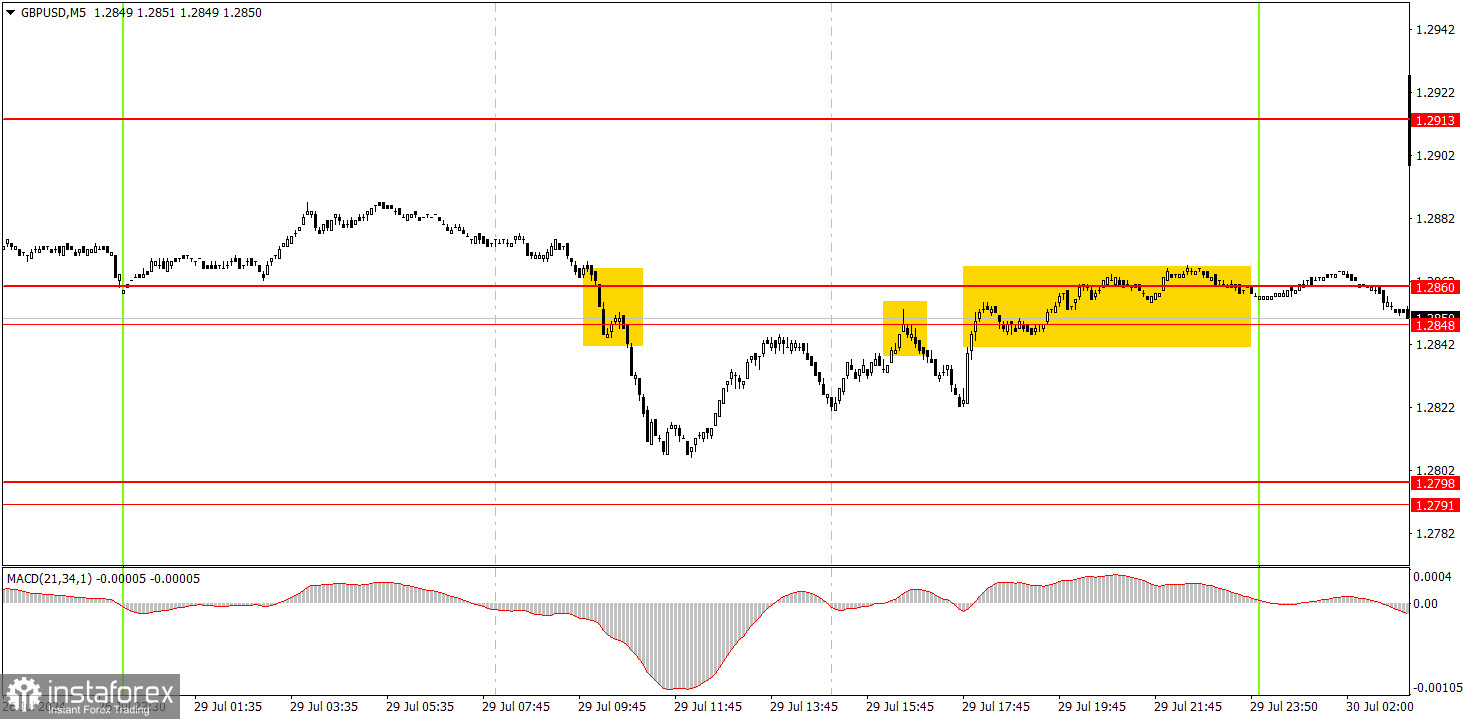
Several trading signals were formed in the 5-minute time frame. The best signal was formed during the European trading session when the price broke through the 1.2848-1.2860 area. Unfortunately, the price only managed to get a few pips into the target area before subsequently returning to the 1.2848-1.2860 range. Therefore, it is unlikely that a profit was made from this short position. However, Monday gives us the opportunity to expect active trading throughout the week.
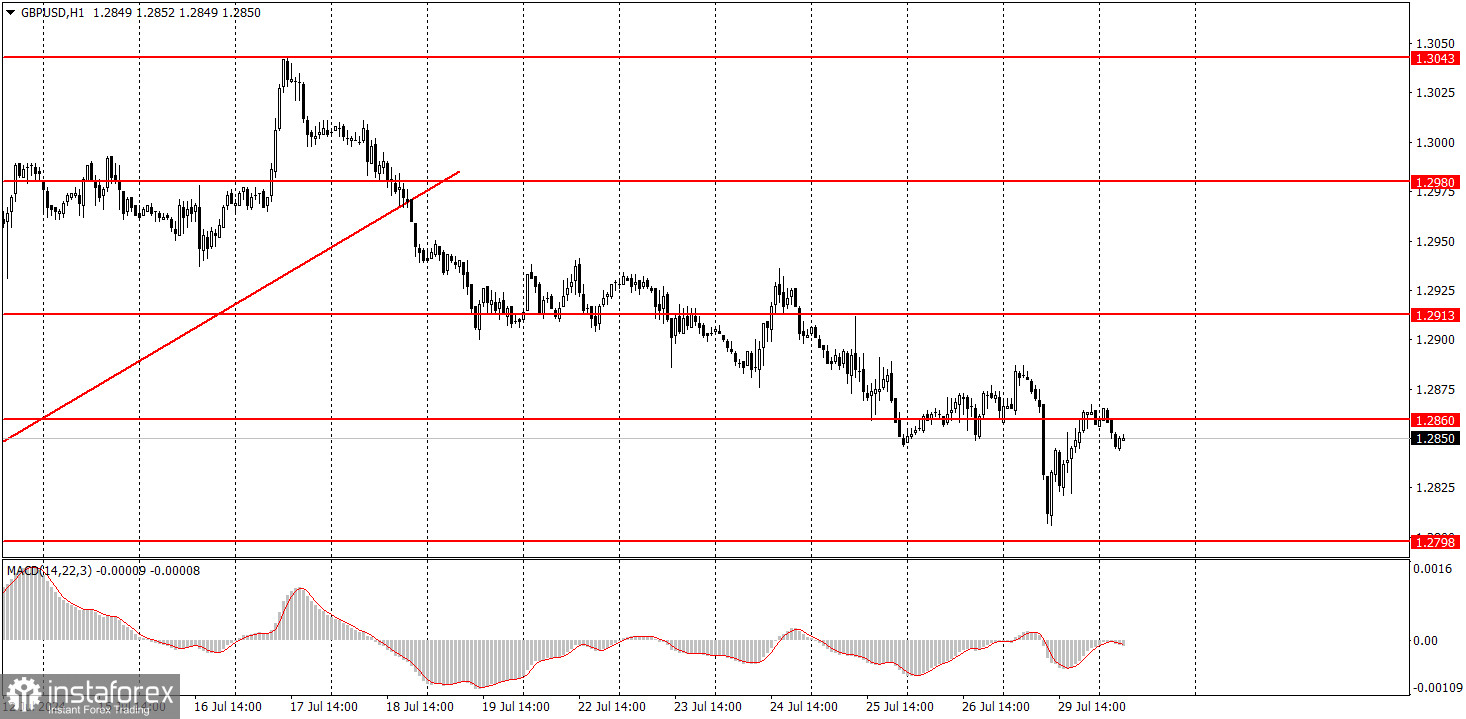
In the hourly time frame, GBP/USD finally has a chance to start a downward trend. The pair has breached the ascending trendline, so we might observe a decline for at least a couple of weeks rather than an increase. Ideally, the pound should drop by at least 400-500 pips. The market has processed all the bullish factors multiple times, the dollar is undervalued, and the BoE may start lowering its rates as early as this week. The British currency has more reasons to fall than to rise.
On Tuesday, novice traders may trade within the range of 1.2848-1.2860. Few news events will affect the pound and the dollar today, so volatility is unlikely to be high.
The key levels to consider on the 5M timeframe are 1.2605-1.2633, 1.2684-1.2693, 1.2748, 1.2791-1.2798, 1.2848-1.2860, 1.2913, 1.2980-1.2993, 1.3043, 1.3102-1.3107, 1.3145. Today, no significant events are scheduled in the UK, while the US will release the JOLTs report on job openings, which is of moderate significance.
1) The strength of a signal is determined by the time it took for the signal to form (bounce or level breakthrough). The shorter the time required, the stronger the signal.
2) If two or more trades around a certain level are initiated based on false signals, subsequent signals from that level should be ignored.
3) In a flat market, any currency pair can produce multiple false signals or none at all. In any case, it's better to stop trading at the first signs of a flat market.
4) Trades should be opened between the start of the European session and mid-way through the U.S. session. All trades must be closed manually after this period.
5) In the hourly time frame, trades based on MACD signals are only advisable amidst substantial volatility and an established trend, confirmed either by a trendline or trend channel.
6) If two levels are too close to each other (from 5 to 20 pips), they should be considered as a support or resistance zone.
7) After moving 15 pips in the intended direction, the Stop Loss should be set to break-even.
Support and Resistance price levels can serve as targets when buying or selling. You can place Take Profit levels near them.
Red lines represent channels or trend lines that depict the current trend and indicate the preferred trading direction.
The MACD (14,22,3) indicator, encompassing both the histogram and signal line, acts as an auxiliary tool and can also be used as a source of signals.
Important speeches and reports (always noted in the news calendar) can profoundly influence the price dynamics. Hence, trading during their release calls for heightened caution. It may be reasonable to exit the market to prevent abrupt price reversals against the prevailing trend.
Beginners should always remember that not every trade will yield profit. Establishing a clear strategy, coupled with effective money management, is key to long-term success in trading.
InstaForex analytical reviews will make you fully aware of market trends! Being an InstaForex client, you are provided with a large number of free services for efficient trading.


