 Stay
Stay 
Trading Conditions
Products
Tools


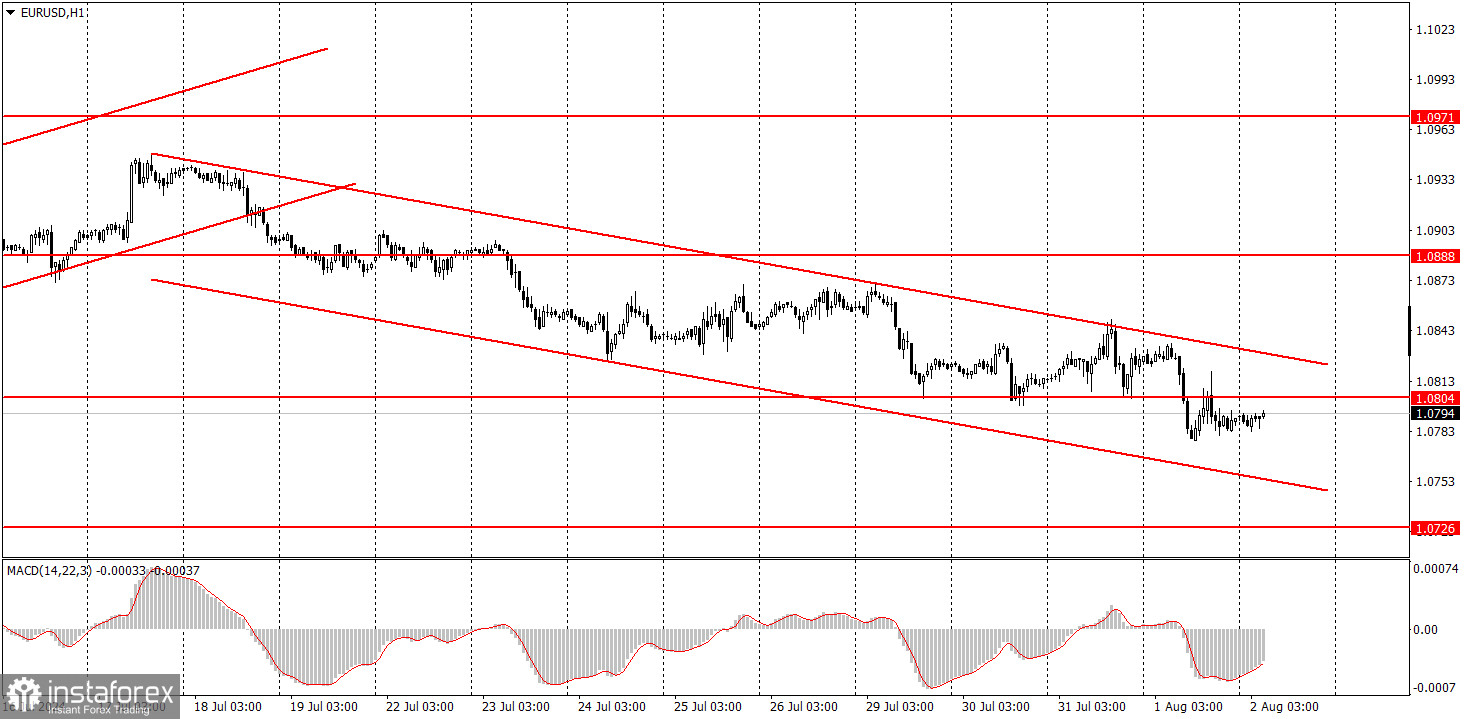
The EUR/USD pair sustained its mild decline on Thursday. A descending channel has formed in the hourly time frame, indicating not so much the direction of movement (already evident) but rather the stability of the downward trend. This week, news was about a possible Federal Reserve rate cut in September. The probability of this is not 100%, but it does represent an increase in dovish rhetoric from Federal Reserve Chair Jerome Powell. Nevertheless, the U.S. dollar continued to rise gradually and steadily. Therefore, we conclude that the main focus now is on the horizontal channel in the 24-hour time frame, which suggests a decline toward the 1.0600-1.0650 range. Initially, the euro rose for several weeks despite the fundamentals and macroeconomics; now, the dollar might exhibit a similar movement.
It is also worth noting that the U.S. ISM Manufacturing Index was published yesterday. It was much weaker than forecasts, which did not derail the market's downward trajectory. Once again, we highlight that the key factor is the market sentiment, and news can be interpreted in various ways or used for corrections.
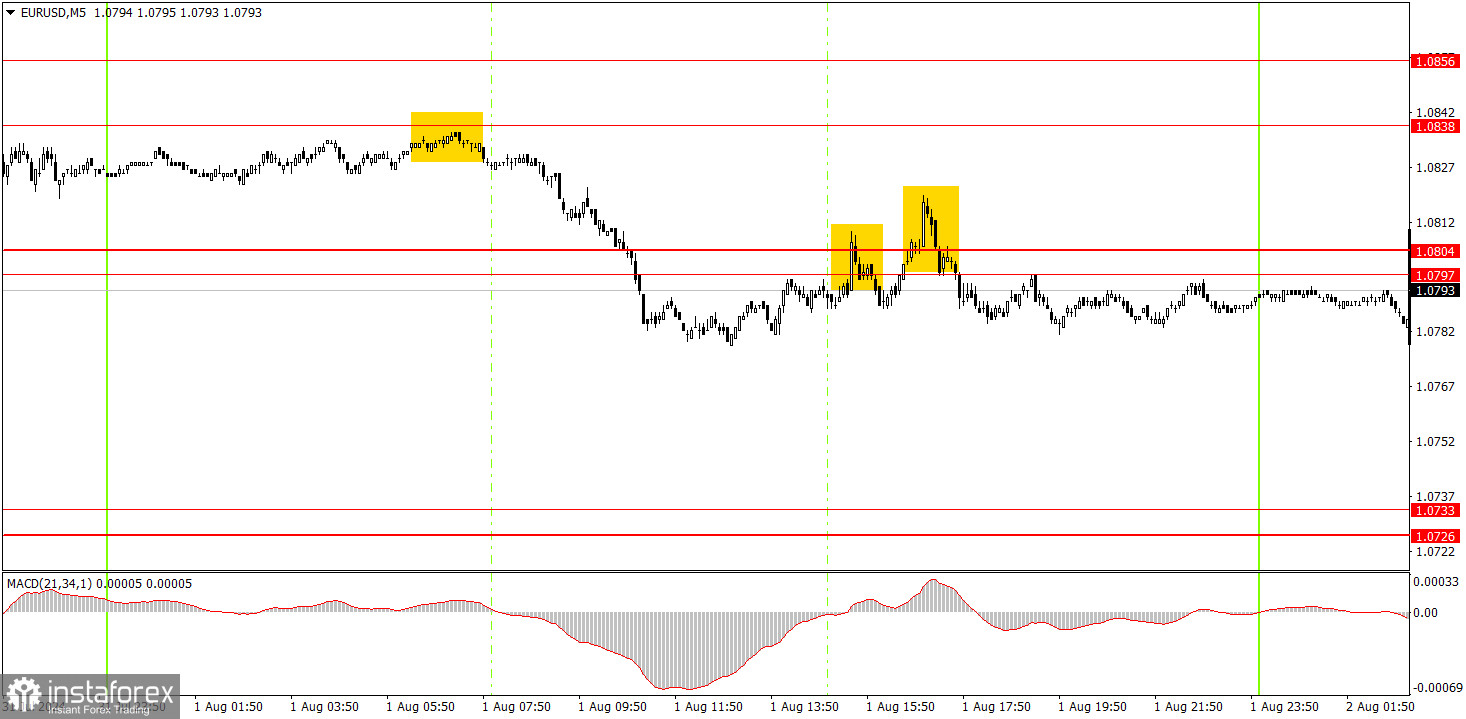
Three trading signals were generated in the 5-minute time frame on Thursday. At the start of the European trading session, the price bounced off the 1.0838 level, fell by about 50 pips, and stabilized below the 1.0797-1.0804 range. However, this movement ended there. During the U.S. session, the dollar was under pressure due to the same ISM index, making it impractical to remain in short positions. Shorts should have been closed below the 1.0797-1.0804 area before or after the ISM release.
In the hourly time frame, EUR/USD sustained its decline. We believe the euro has fully factored in all the bullish factors, so a significant correction is needed. However, the nature of the movements is best seen in the 24-hour timeframe. In general, this is a range-bound market between 1.0600 and 1.1000. Volatility remains low, and the market has stopped reacting to macro data and events, or interprets them in its own way.
On Friday, novice traders might consider trading around the 1.0797-1.0804 area. However, it's important to note that significant U.S. data will be released today, which could prompt a rise in the pair.
The key levels to consider on the 5M timeframe are 1.0526, 1.0568, 1.0611, 1.0678, 1.0726-1.0733, 1.0797-1.0804, 1.0838-1.0856, 1.0888-1.0896, 1.0940, and 1.0971-1.0981. No major reports are scheduled for the Eurozone on Friday, but the U.S. will release crucial NonFarm Payrolls and unemployment rate data. Significant movements are expected in the second half of the day.
1) The strength of a signal is determined by the time it took for the signal to form (bounce or level breakthrough). The shorter the time required, the stronger the signal.
2) If two or more trades around a certain level are initiated based on false signals, subsequent signals from that level should be ignored.
3) In a flat market, any currency pair can produce multiple false signals or none at all. In any case, it's better to stop trading at the first signs of a flat market.
4) Trades should be opened between the start of the European session and mid-way through the U.S. session. All trades must be closed manually after this period.
5) In the hourly time frame, trades based on MACD signals are only advisable amidst substantial volatility and an established trend, confirmed either by a trendline or trend channel.
6) If two levels are too close to each other (from 5 to 20 pips), they should be considered as a support or resistance zone.
7) After moving 15 pips in the intended direction, the Stop Loss should be set to break-even.
Support and Resistance price levels can serve as targets when buying or selling. You can place Take Profit levels near them.
Red lines represent channels or trend lines that depict the current trend and indicate the preferred trading direction.
The MACD (14,22,3) indicator, encompassing both the histogram and signal line, acts as an auxiliary tool and can also be used as a source of signals.
Important speeches and reports (always noted in the news calendar) can profoundly influence the price dynamics. Hence, trading during their release calls for heightened caution. It may be reasonable to exit the market to prevent abrupt price reversals against the prevailing trend.
Beginners should always remember that not every trade will yield profit. Establishing a clear strategy, coupled with effective money management, is key to long-term success in trading.
InstaForex analytical reviews will make you fully aware of market trends! Being an InstaForex client, you are provided with a large number of free services for efficient trading.

