 Stay
Stay 
Trading Conditions
Products
Tools


On Friday, the EUR/USD pair showed a strong rally, triggered by disappointing US data on the labor market and unemployment. The number of Nonfarm Payrolls for July was only 114,000, significantly below much higher forecasts. In addition, the unemployment rate jumped from 4.1% to 4.3%. Thus, there were reasons for panic selling the dollar on Friday.
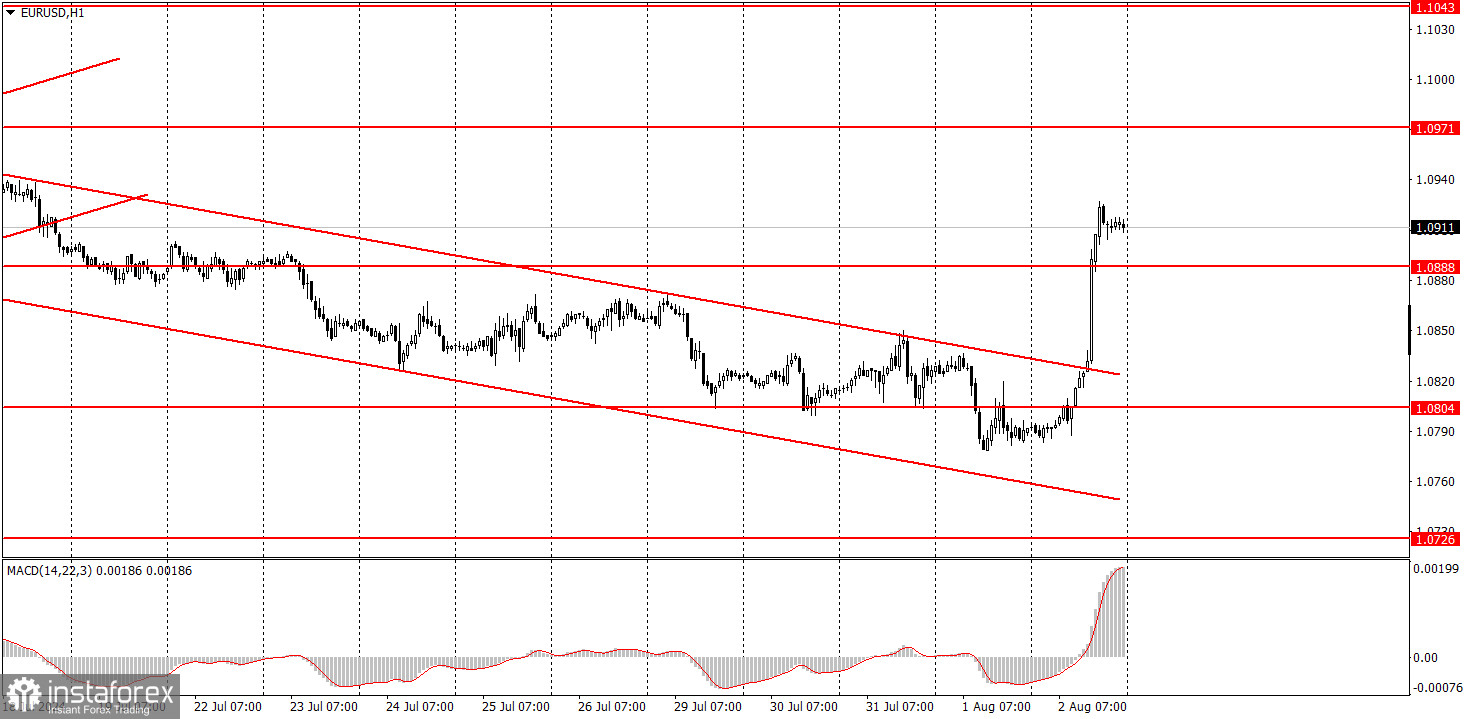
We have repeatedly said that the euro grows on rather formal events and reports, but this time, it was different. The market truly had every right to sell off the dollar. The price consolidated above the descending channel, breaking the short-term downward trend. Can we expect further growth of the pair? From our perspective, no, as the overall fundamental background remains unchanged. Economic reports from the US continue to disappoint, but this is offset by the Federal Reserve maintaining a tight monetary policy. Whether the Fed will begin easing in September is a question that will be answered in September.
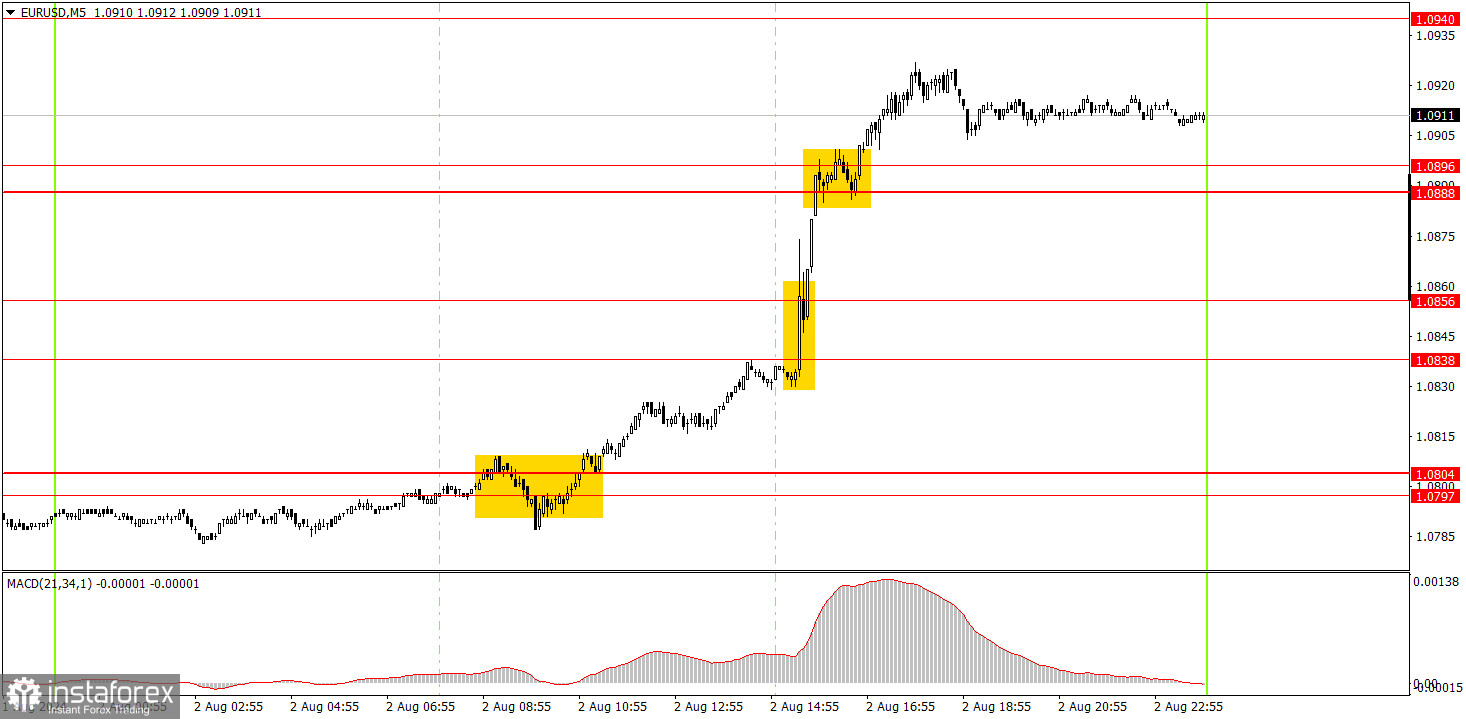
On Friday, the 5-minute time frame presented several clear trading signals and a favorable market movement. The first buy signal formed in the morning when the price crossed the area of 1.0797-1.0804. Long positions could have been opened at that time. At the beginning of the American session, when important data were published in the US, the Stop Loss could have been transferred to break even, and long positions could have been maintained. By the end of the day, the pair rose to 1.0911, where profits could have been taken, amounting to about 100 pips.
In the hourly time frame, EUR/USD sharply rose, breaking the downward trend. We believe the euro has fully factored in all the bullish factors, so we do not expect the upward movement to continue. Yes, the US data let the dollar down again on Friday, but this does not mean the greenback will depreciate daily. The 24-hour timeframe continues to show a flat range between 1.06 and 1.10. There is no reason to leave this range yet.
On Monday, beginners might trade from the area of 1.0888-1.0896. However, volatility may decrease sharply again, and a downward correction looms after Friday.
The key levels to consider on the 5M timeframe are 1.0526, 1.0568, 1.0611, 1.0678, 1.0726-1.0733, 1.0797-1.0804, 1.0838-1.0856, 1.0888-1.0896, 1.0940, 1.0971-1.0981. On Monday, July's service sector business activity indices will be published in the European Union, Germany, and the US. Traders should focus on the US ISM index.
1) The strength of a signal is determined by the time it took for the signal to form (bounce or level breakthrough). The shorter the time required, the stronger the signal.
2) If two or more trades around a certain level are initiated based on false signals, subsequent signals from that level should be ignored.
3) In a flat market, any currency pair can produce multiple false signals or none at all. In any case, it's better to stop trading at the first signs of a flat market.
4) Trades should be opened between the start of the European session and mid-way through the U.S. session. All trades must be closed manually after this period.
5) In the hourly time frame, trades based on MACD signals are only advisable amidst substantial volatility and an established trend, confirmed either by a trendline or trend channel.
6) If two levels are too close to each other (from 5 to 20 pips), they should be considered as a support or resistance zone.
7) After moving 15 pips in the intended direction, the Stop Loss should be set to break-even.
Support and Resistance price levels can serve as targets when buying or selling. You can place Take Profit levels near them.
Red lines represent channels or trend lines that depict the current trend and indicate the preferred trading direction.
The MACD (14,22,3) indicator, encompassing both the histogram and signal line, acts as an auxiliary tool and can also be used as a source of signals.
Important speeches and reports (always noted in the news calendar) can profoundly influence the price dynamics. Hence, trading during their release calls for heightened caution. It may be reasonable to exit the market to prevent abrupt price reversals against the prevailing trend.
Beginners should always remember that not every trade will yield profit. Establishing a clear strategy, coupled with effective money management, is key to long-term success in trading.
InstaForex analytical reviews will make you fully aware of market trends! Being an InstaForex client, you are provided with a large number of free services for efficient trading.

