 Stay
Stay 
Trading Conditions
Products
Tools


On Wednesday, the GBP/USD pair also showed no interesting movements. Volatility dropped to low levels for the pound sterling, but it is pleasing that at least the pound is not rising unreasonably, as it likes to do in 2024. Unfortunately, the market situation is unstable, and it is impossible to predict how the market will interpret the fundamental background in the coming months. It is worth remembering that for most of this year, the dollar has been under market pressure simply because, in the market's view, the Federal Reserve is "about to start easing monetary policy." Now, the dollar may "come under fire" amidst market expectations of a 0.5% rate cut in September. Some believe another weak nonfarm payrolls and unemployment data in August means that the U.S. economy has entered a recession, and there is no other choice but to lower the Fed rate. The fact that U.S. GDP grew by 2.8% in the second quarter, significantly above forecasts, is not considered.
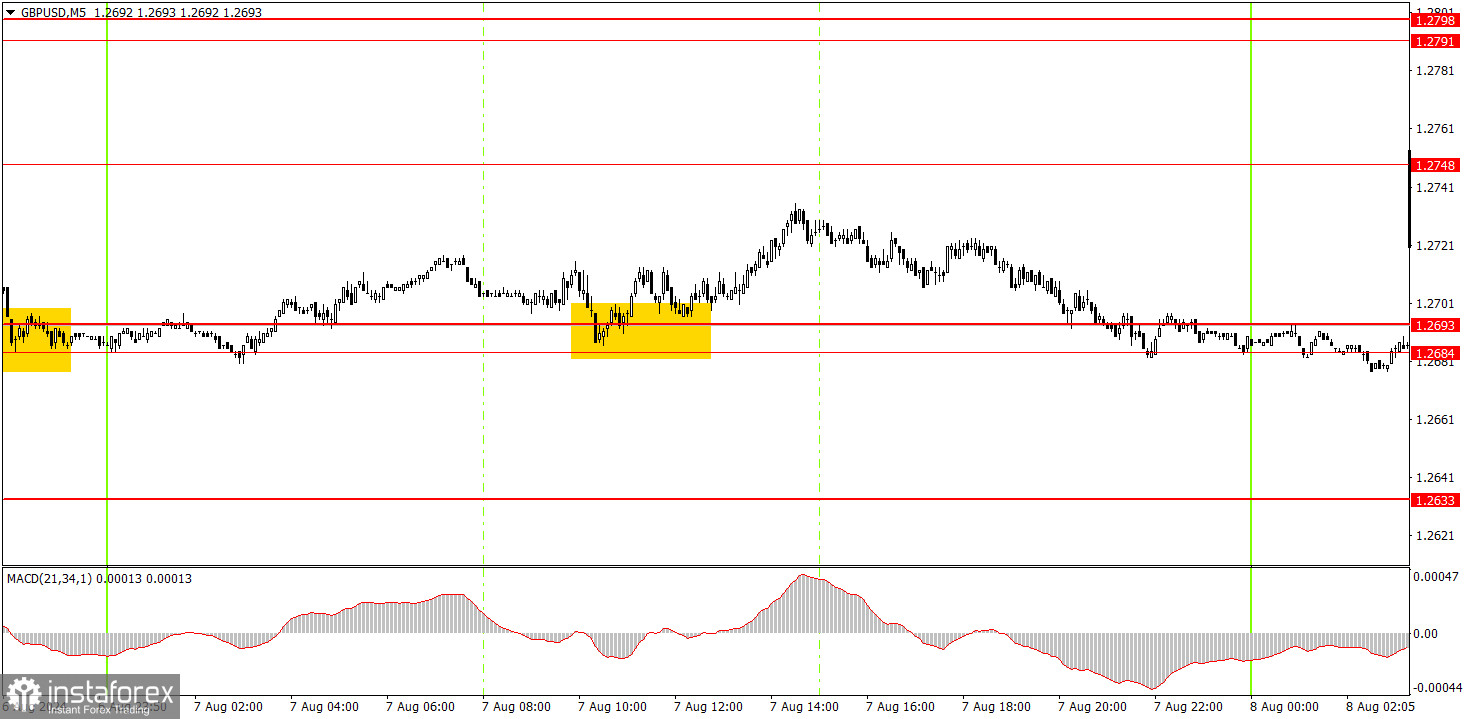
One trading signal was formed in the 5-minute time frame on Wednesday, and the overall volatility for the day was 55 pips. During the European trading session, the price rebounded from the 1.2684-1.2693 area, after which it rose by about 25 pips. It did not reach the nearest target level of 1.2748, so traders could only earn a small profit by manually closing the trade.
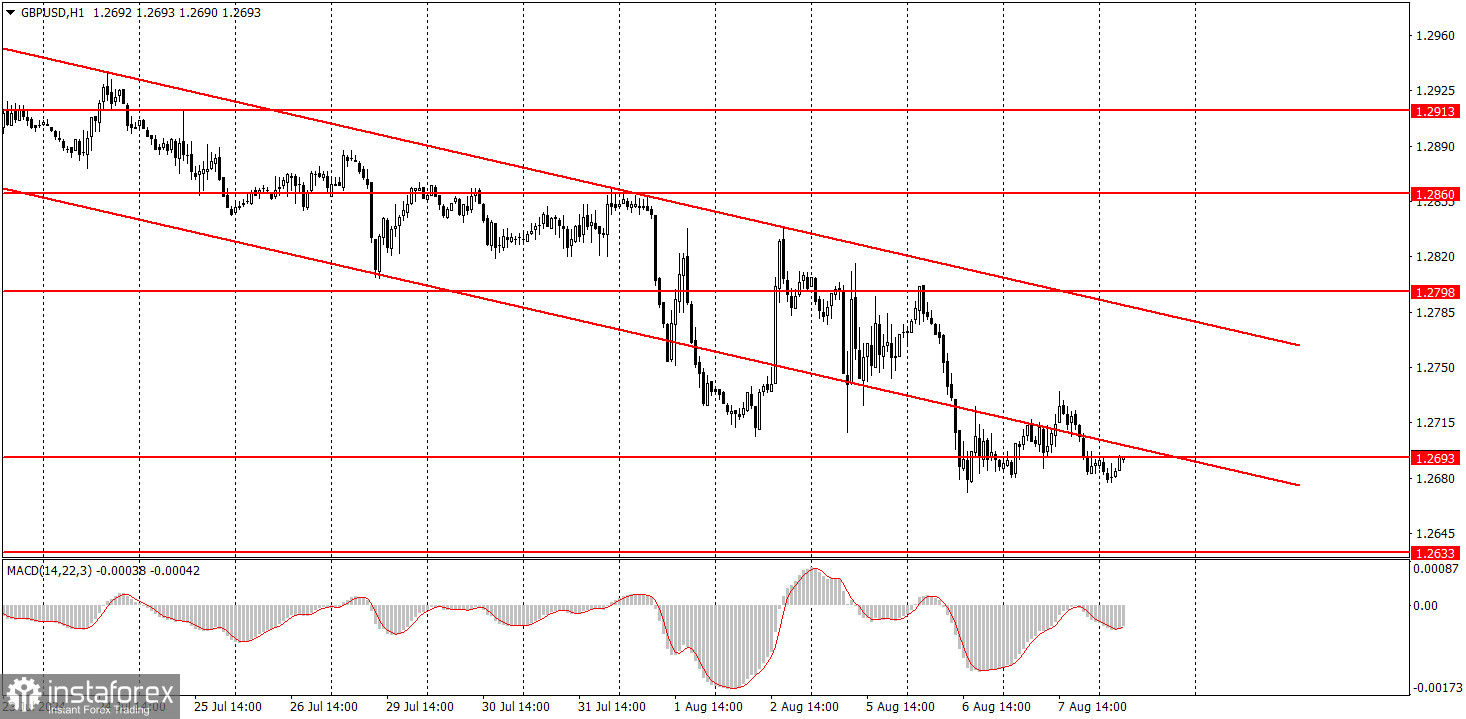
GBP/USD has a good chance of sustaining its downtrend in the hourly time frame. The British pound is still overbought, the dollar is undervalued, and the Bank of England has started lowering its borrowing costs—what more is needed to sustain the pound's decline? A bullish correction is looming at this time, but the pound can quite justifiably continue to decline simply because it has risen for the last three months. And often, it has risen, as usual, without any solid reasons.
On Thursday, novice traders may trade from the 1.2684-1.2693 area. However, volatility is likely to be low again.
The key levels to consider on the 5M timeframe are 1.2547, 1.2605-1.2633, 1.2684-1.2693, 1.2748, 1.2791-1.2798, 1.2848-1.2860, 1.2913, 1.2980-1.2993, 1.3043, 1.3102-1.3107, 1.3145. On Thursday, no significant events are scheduled again in the UK and the U.S., so nothing should hinder the pair from correcting upwards.
1) The strength of a signal is determined by the time it took for the signal to form (bounce or level breakthrough). The shorter the time required, the stronger the signal.
2) If two or more trades around a certain level are initiated based on false signals, subsequent signals from that level should be ignored.
3) In a flat market, any currency pair can produce multiple false signals or none at all. In any case, it's better to stop trading at the first signs of a flat market.
4) Trades should be opened between the start of the European session and mid-way through the U.S. session. All trades must be closed manually after this period.
5) In the hourly time frame, trades based on MACD signals are only advisable amidst substantial volatility and an established trend, confirmed either by a trendline or trend channel.
6) If two levels are too close to each other (from 5 to 20 pips), they should be considered as a support or resistance zone.
7) After moving 15 pips in the intended direction, the Stop Loss should be set to break-even.
Support and Resistance price levels: targets when opening long or short positions. You can place Take Profit levels near them.
Red lines represent channels or trend lines that depict the current trend and indicate the preferred trading direction.
The MACD (14,22,3) indicator, encompassing both the histogram and signal line, acts as an auxiliary tool and can also be used as a source of signals.
Important speeches and reports (always noted in the news calendar) can profoundly influence the price dynamics. Hence, trading during their release calls for heightened caution. It may be reasonable to exit the market to prevent abrupt price reversals against the prevailing trend.
Beginners should always remember that not every trade will yield profit. Establishing a clear strategy, coupled with effective money management, is key to long-term success in trading.
InstaForex analytical reviews will make you fully aware of market trends! Being an InstaForex client, you are provided with a large number of free services for efficient trading.

