 Stay
Stay 
Trading Conditions
Products
Tools


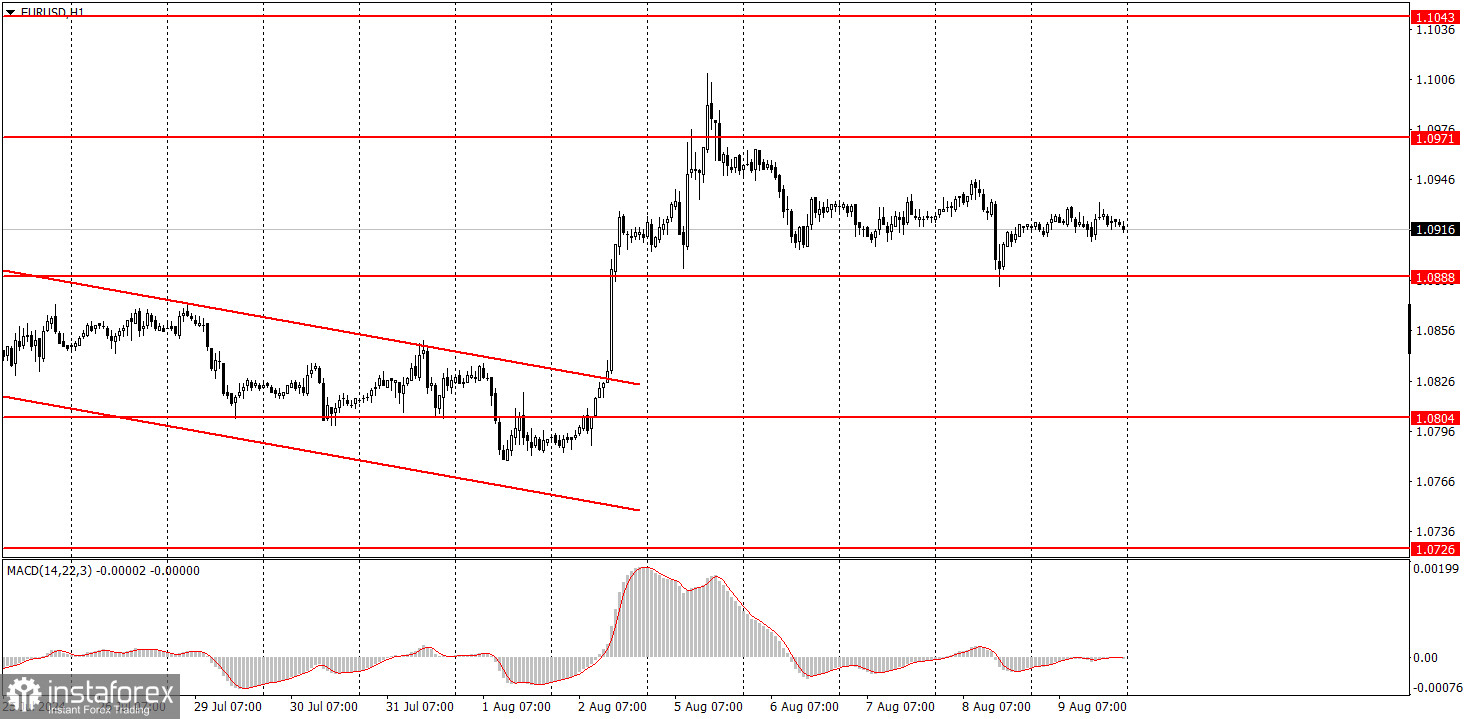
EUR/USD showed no interest in significant movement on Friday. As we feared, the market quickly calmed down after the spike in volatility at the end of last week and the beginning of this week, and volatility indicators returned to low values. Therefore, on Friday, we again observed movements of just 23 pips. There is nothing special to analyze from Friday. In the morning, the second estimate of July inflation was published in Germany, which was identical to the first and had no impact on the pair's movement. The surge in the euro was based on the market's inflated expectations for a Federal Reserve rate cut, which may not happen in reality.
The pair remains within the horizontal channel on the daily time frame – 1.0600-1.1000. Therefore, if the price does not leave this range, we believe a drop toward 1.0600 is much more likely.
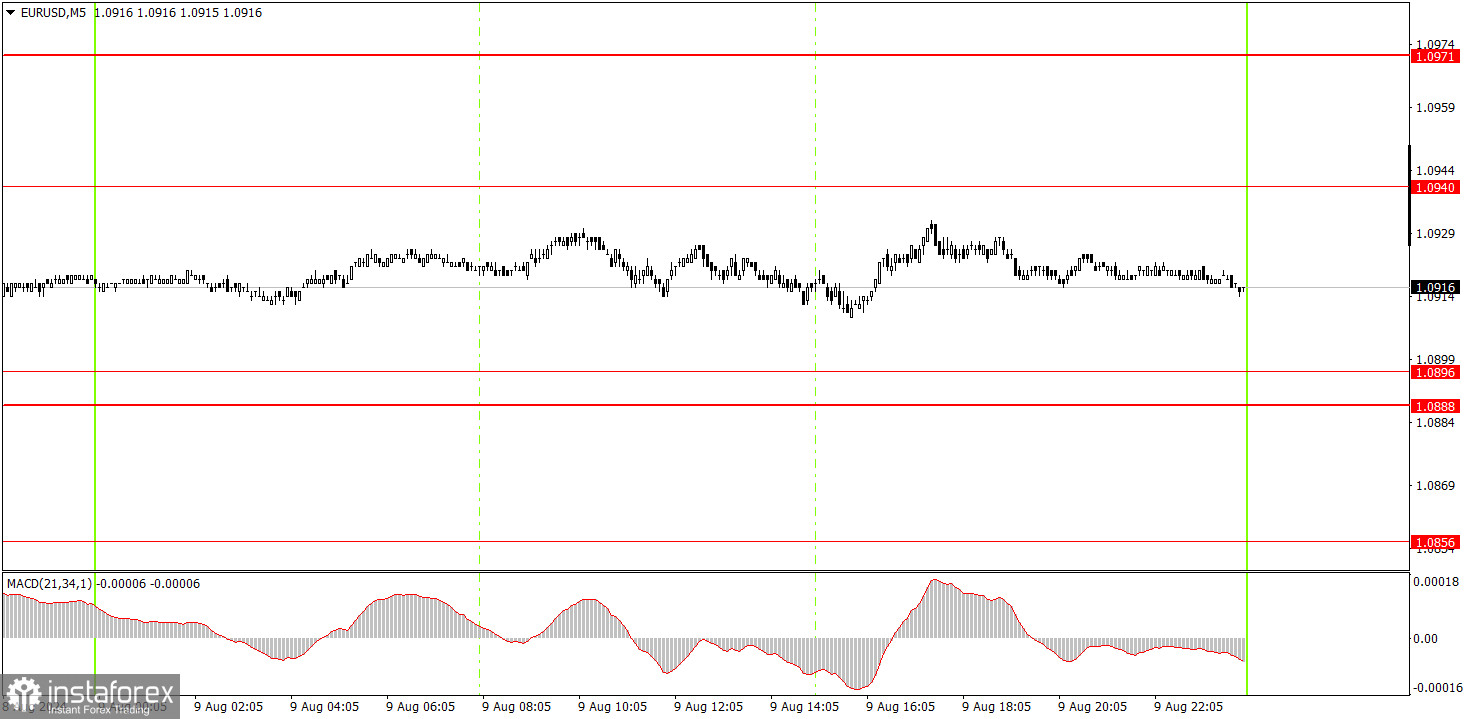
In the 5-minute time frame on Friday, no trading signals were formed, and the pair moved strictly sideways with low volatility. Thus, there were no opportunities for beginners to enter the market.
EUR/USD broke the short-term downward trend in the hourly time frame but couldn't rise above the 1.10 level. We believe the euro has fully factored in all the bullish factors, so we do not expect the upward movement to continue. The pair remains flat in the 1.06-1.10 range in the 24-hour time frame. There are currently no reasons to leave this range. We still expect the euro to fall, as the European Central Bank has begun easing monetary policy while the Federal Reserve has not.
On Monday, novice traders can remain in long positions after the price rebounds from the 1.0888-1.0896 area. Since volatility has dropped to low levels again, executing any signal may take several days.
The key levels to consider on the 5M time frame are 1.0526, 1.0568, 1.0611, 1.0678, 1.0726-1.0733, 1.0797-1.0804, 1.0838-1.0856, 1.0888-1.0896, 1.0940, 1.0971, 1.1011, 1.1043, 1.1091. No significant events are scheduled for Monday in the Eurozone or the US. Therefore, movements are likely to be very weak again.
1) The strength of a signal is determined by the time it took for the signal to form (bounce or level breakthrough). The shorter the time required, the stronger the signal.
2) If two or more trades around a certain level are initiated based on false signals, subsequent signals from that level should be ignored.
3) In a flat market, any currency pair can produce multiple false signals or none at all. In any case, it's better to stop trading at the first signs of a flat market.
4) Trades should be opened between the start of the European session and mid-way through the U.S. session. All trades must be closed manually after this period.
5) In the hourly time frame, trades based on MACD signals are only advisable amidst substantial volatility and an established trend, confirmed either by a trendline or trend channel.
6) If two levels are too close to each other (from 5 to 20 pips), they should be considered as a support or resistance zone.
7) After moving 15 pips in the intended direction, the Stop Loss should be set to break-even.
Support and Resistance price levels: targets when opening long or short positions. You can place Take Profit levels near them.
Red lines represent channels or trend lines that depict the current trend and indicate the preferred trading direction.
The MACD (14,22,3) indicator, encompassing both the histogram and signal line, acts as an auxiliary tool and can also be used as a source of signals.
Important speeches and reports (always noted in the news calendar) can profoundly influence the price dynamics. Hence, trading during their release calls for heightened caution. It may be reasonable to exit the market to prevent abrupt price reversals against the prevailing trend.
Beginners should always remember that not every trade will yield profit. Establishing a clear strategy, coupled with effective money management, is key to long-term success in trading.
InstaForex analytical reviews will make you fully aware of market trends! Being an InstaForex client, you are provided with a large number of free services for efficient trading.

