 Stay
Stay 
Trading Conditions
Products
Tools


The wave pattern for the GBP/USD pair remains quite complex and highly ambiguous. For a while, the wave structure appeared convincing and suggested the formation of a downward wave set targeting levels below the 1.2300 figure. However, in practice, demand for the U.S. dollar increased too much for this scenario to play out.
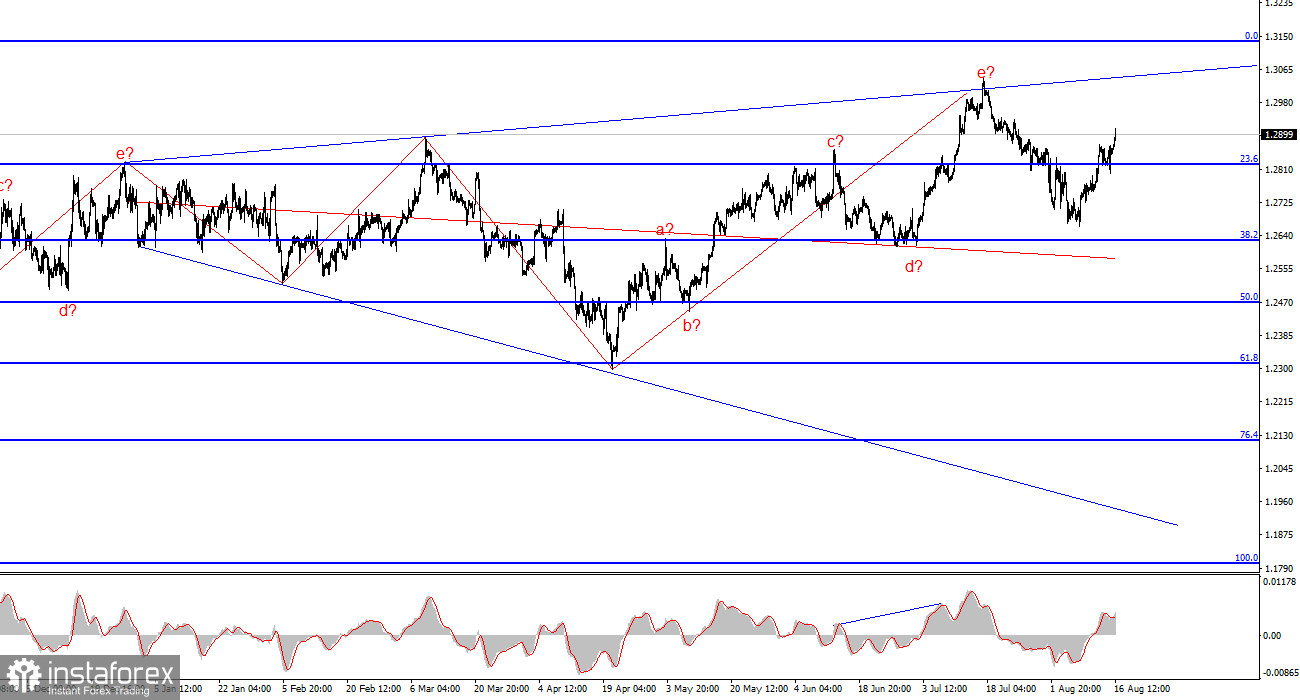
Currently, the wave pattern has become completely unreadable. I should remind you that in my analysis, I strive to use simple structures, as complex ones have too many nuances and ambiguities. What we see now is an upward wave that has overridden a downward wave, which in turn had overridden a previous upward wave, which had overridden a previous downward wave (all of these waves are within a triangle). The only assumption that can be made is an expanding triangle with the upper point around the 1.3000 level and the balancing line around the 1.2600 level. The upper line of the triangle was reached, and the unsuccessful attempt to break it indicated the market's readiness to form a downward set of waves, the first of which is already completed.
The GBP/USD exchange rate increased by 60 basis points during Friday's session, but then began to retreat from the peaks reached. Neither the first movement nor the second can be considered entirely logical, as there was news on both occasions: in the morning and in the afternoon. My readers could reasonably expect these news events to be reflected in the market. In the morning, a report on retail sales was released in the UK, showing a 0.5% increase month-on-month and a 1.4% year-on-year increase in July. Both values matched market expectations. However, the pound started rising overnight and continued to gain during the morning. Why, if expectations matched reality? This time, the market paid attention to the fact that the June figure was revised upwards. Last month, a decline of 1.2% was recorded, but it was revised to -0.9%. The market simply needed a new reason to buy the instrument.
During the U.S. session, a report on the number of building permits issued in the U.S. for July was released. The number was lower than market expectations, but as we can see, the dollar began the U.S. session with strengthening. I believe that the current wave b in the new downward structure is already quite strong, so I expect the formation of a downward wave c to begin. The U.S. dollar had reasons to decline in the last 5-6 hours, yet it did not. At this point, wave b has retraced 61.8% of wave a. In my opinion, this is a good point to enter sales. However, I also consider the possibility of the instrument rising to 1.2953, which corresponds to the 76.4% Fibonacci retracement level.
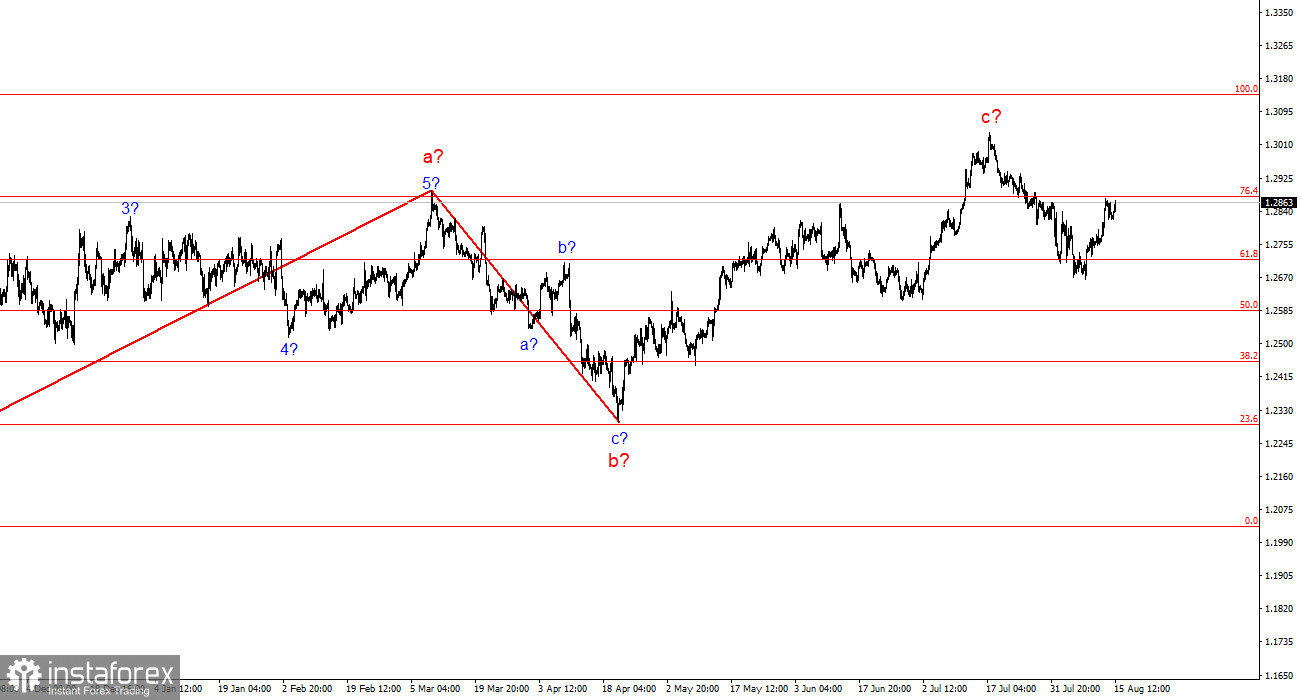
The wave pattern for the GBP/USD instrument still suggests a decline. If an upward segment of the trend began on April 22, it has already taken on a five-wave form. Therefore, at the very least, a three-wave correction should now be expected. In my opinion, it is advisable to consider selling the instrument in the near future with targets around the 1.2627 mark, which corresponds to 38.2% on the Fibonacci retracement, and lower.
On a larger wave scale, the wave pattern has transformed. We can now assume the formation of a complex and extended upward corrective structure. At the moment, it is a three-wave pattern, but it could evolve into a five-wave structure, which may take several more months or even longer to complete.
Key Principles of My Analysis:
InstaForex analytical reviews will make you fully aware of market trends! Being an InstaForex client, you are provided with a large number of free services for efficient trading.

