 Stay
Stay 
Trading Conditions
Products
Tools


The EUR/USD pair exhibited a new upward movement on Monday. It goes without saying that there were no reasons for the euro to rise further. No secondary reports were released throughout the day, and no notable speeches took place. Yes, a few Federal Reserve representatives gave interviews in the U.S., but they have been saying roughly the same thing for the past three weeks: the central bank will consider possibly lowering the key rate in September. Thus, if new statements about easing monetary policy triggered the dollar's decline, the market is simply using any formal factor to sell the dollar, as it has before. If not, the market sells the U.S. currency without any reason.
From a technical perspective, the upward trend remains valid, and the euro could continue to rise indefinitely. The market's sentiment is clear-it currently has no need for reasons to buy. Fed Chair Jerome Powell will speak on Friday, and there is no doubt that the market will look for dovish hints in his speech to sell the dollar.
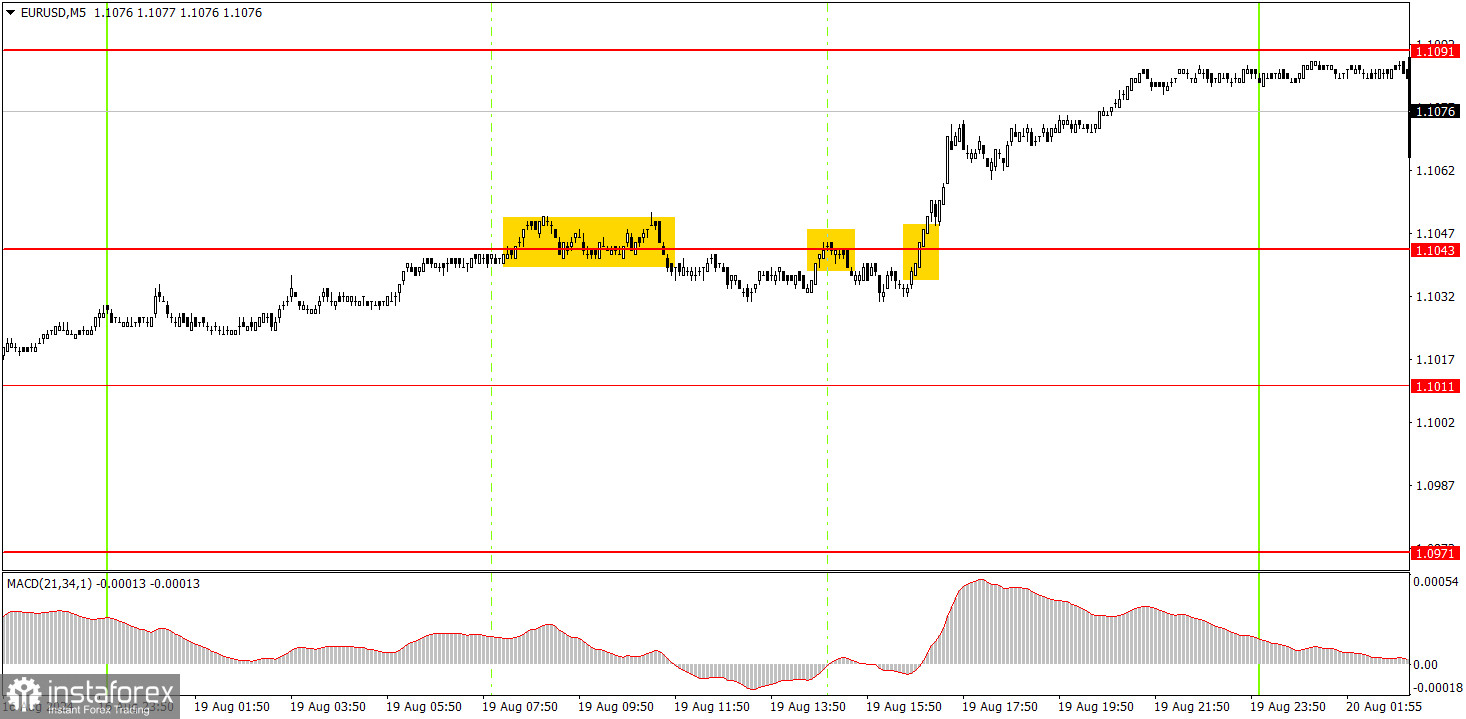
Three trading signals were formed in the 5-minute time frame on Monday. Initially, the price generated two sell signals around the 1.1043 level, which, by the end of the day, was transformed into the 1.1048 level and then surpassed. The short position did not yield profit as the market failed to correct the pair downward slightly. The long position was profitable, and the price reached the nearest target of 1.1091 closer to the evening.
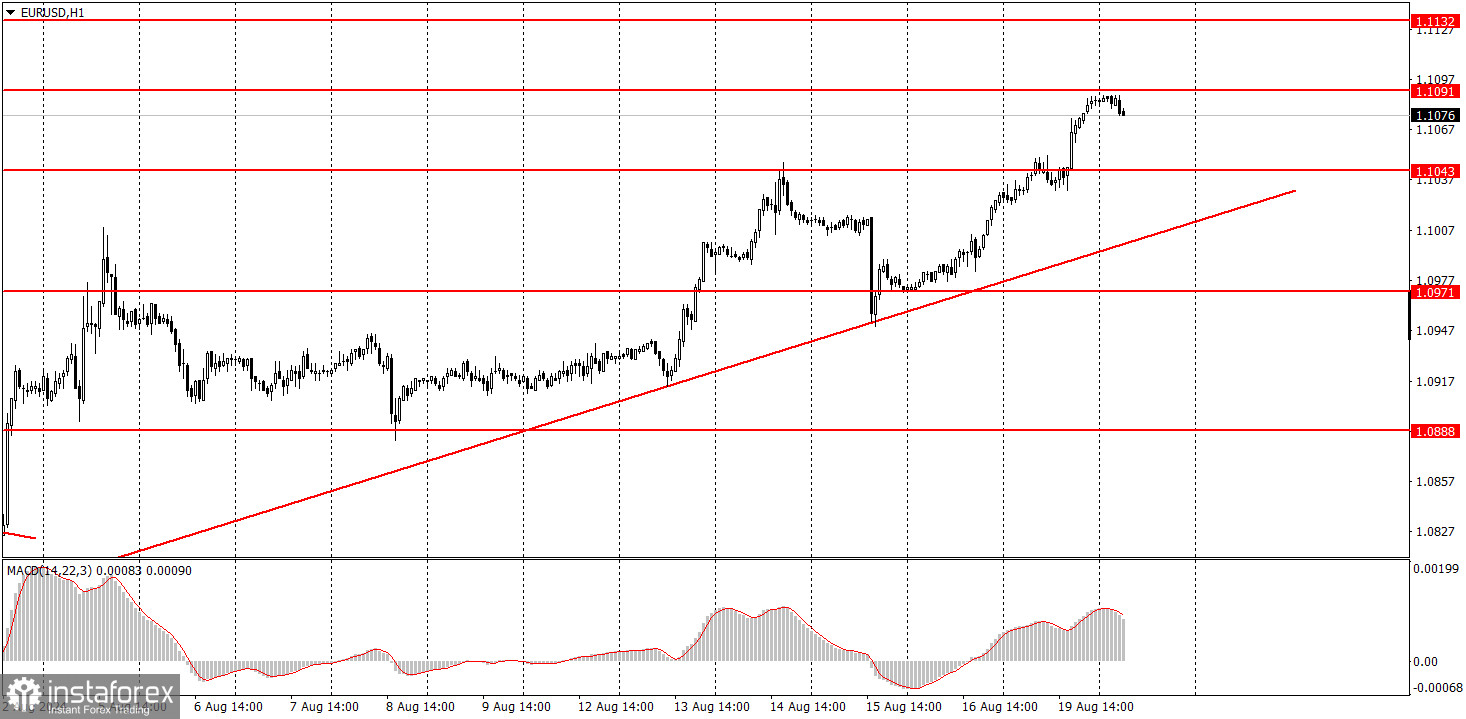
EUR/USD has formed a new upward trend supported by a trend line in the hourly time frame. We believe the euro has fully factored in all the bullish factors, so we do not expect further upward movement. However, the market again shows it is ready to react to almost any report by panic selling the dollar. And if there are no events, it is prepared to sell the dollar. Therefore, expectations aside, the current technical picture should not be ignored. A decline in the pair can be expected after the price consolidates below the trendline.
On Tuesday, novice traders might anticipate a decline if the price consolidates below the trendline. In this case, the euro could drop to 1.0888. Otherwise, the pair may continue to rise with a target of 1.1132.
The key levels to consider on the 5M time frame are 1.0611, 1.0678, 1.0726-1.0733, 1.0797-1.0804, 1.0838-1.0856, 1.0888-1.0896, 1.0940, 1.0971, 1.1011, 1.1048, 1.1091, 1.1132, 1.1184. On Tuesday, neither the Eurozone nor the U.S. has any significant fundamental or macroeconomic events scheduled. The second estimate of EU inflation for July is unlikely to provoke a market reaction.
1) The strength of a signal is determined by the time it takes for the signal to form (bounce or level breakthrough). The less time it took, the stronger the signal.
2) If two or more trades around a certain level are initiated based on false signals, subsequent signals from that level should be ignored.
3) In a flat market, any currency pair can form multiple false signals or none at all. In any case, it's better to stop trading at the first signs of a flat market.
4) Trades should be opened between the start of the European session and midway through the U.S. session. After this period, all trades must be closed manually.
5) In the hourly time frame, trades based on MACD signals are only advisable amidst substantial volatility and an established trend confirmed by a trendline or trend channel.
6) If two levels are too close to each other (5 to 20 pips), they should be considered support or resistance.
7) After moving 20 pips in the intended direction, the Stop Loss should be set to break even.
Support and Resistance price levels: targets for opening long or short positions. You can place Take Profit levels near them.
Red lines: channels or trend lines that depict the current trend and indicate the preferred trading direction.
The MACD (14,22,3) indicator, encompassing both the histogram and signal line, acts as an auxiliary tool and can also be used as a source of signals.
Important speeches and reports (always noted in the news calendar) can profoundly influence the movement of a currency pair. Hence, trading during their release calls for heightened caution. It may be reasonable to exit the market to prevent abrupt price reversals against the prevailing trend.
Beginners should always remember that not every trade will yield profit. Developing a clear strategy and effective money management is key to success in trading over a long period.
InstaForex analytical reviews will make you fully aware of market trends! Being an InstaForex client, you are provided with a large number of free services for efficient trading.


