 Stay
Stay 
Trading Conditions
Products
Tools


The EUR/USD pair continued its relentless rise on Friday. During the week, we assumed that Jerome Powell's speech on Friday had already been priced in, as the U.S. dollar had been declining throughout the week, and the market naturally anticipated only a dovish stance from the Federal Reserve head. However, as it turned out yesterday, the market still seizes any opportunity to sell the dollar. It doesn't matter how often the same event needs to be priced in. In the evening, when Powell announced readiness to begin monetary easing in September, the market received a new reason to sell the dollar, resulting in another sharp decline.
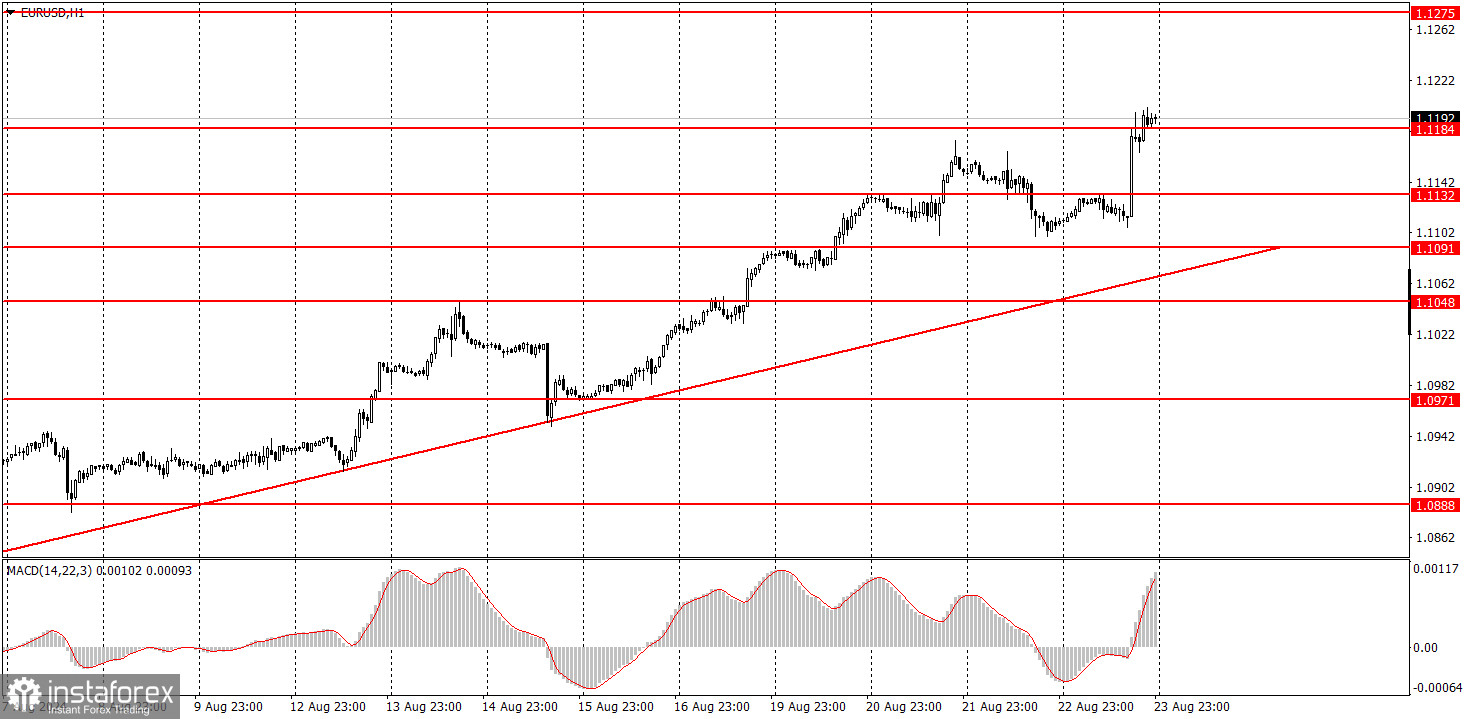
From a technical perspective, the situation remains unchanged. The price is still above the trendline, implying further growth for the euro. The single currency may benefit from this situation since the macroeconomic and fundamental backdrop from the Eurozone does not suggest that the euro should strengthen. However, the market ignores these factors, so the euro continues to rise.
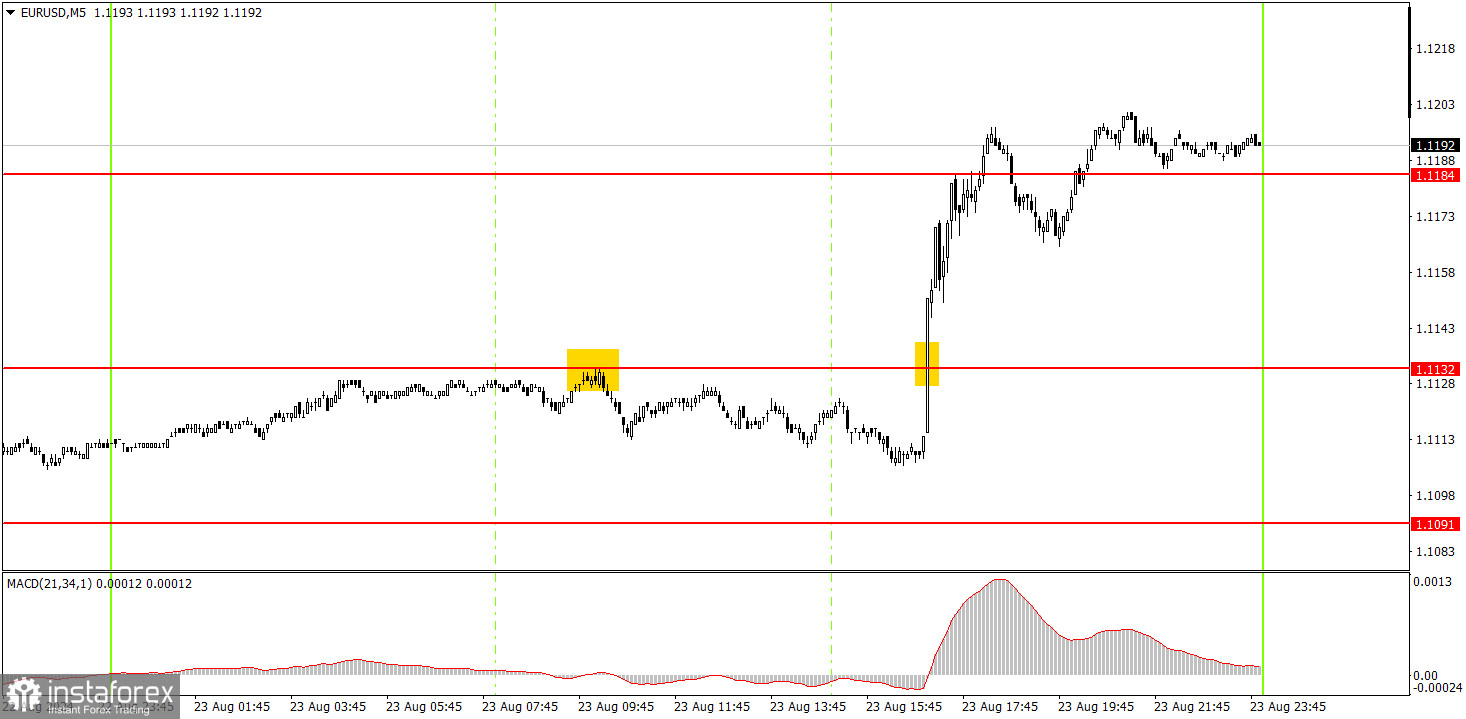
Two trading signals were formed in the 5-minute chart on Friday. The price bounced off the 1.1132 level during the European session, leading to a 20-pip drop. The short position closed with minimal profit or at breakeven. Before Powell's speech, it was advisable to exit all trades or set a Stop Loss to break even. A buy signal was formed around the same level, but there was no opportunity to react.
EUR/USD continues to form an upward trend supported by a trend line in the hourly time frame. We believe the euro has fully factored in all the bullish factors, so we do not expect further upward movement. However, the market again shows it is ready to react to almost any event by panic selling the dollar. And if there are no events, it is prepared to sell the dollar for the sake of it. We can expect a drop in the pair after it consolidates below the trend line.
On Monday, novice traders might anticipate a decline, as prices cannot rise forever. However, it is important to understand that we have a strong uptrend and a clear breakout of the next resistance level at 1.1184.
The key levels to consider on the 5M time frame are 1.0726-1.0733, 1.0797-1.0804, 1.0838-1.0856, 1.0888-1.0896, 1.0940, 1.0971, 1.1011, 1.1048, 1.1091, 1.1132, 1.1184, 1.1275-1.1292. On Monday, no major events are scheduled in the Eurozone, while the U.S. will release a significant report on durable goods orders. This report is unlikely to affect the overall market sentiment, but its strong figures might temporarily support the dollar.
1) The strength of a signal is determined by the time it takes for the signal to form (bounce or level breakthrough). The less time it took, the stronger the signal.
2) If two or more trades around a certain level are initiated based on false signals, subsequent signals from that level should be ignored.
3) In a flat market, any currency pair can form multiple false signals or none at all. In any case, it's better to stop trading at the first signs of a flat market.
4) Trades should be opened between the start of the European session and midway through the U.S. session. After this period, all trades must be closed manually.
5) In the hourly time frame, trades based on MACD signals are only advisable amidst substantial volatility and an established trend confirmed by a trendline or trend channel.
6) If two levels are too close to each other (5 to 20 pips), they should be considered support or resistance.
7) After moving 15 pips in the intended direction, the Stop Loss should be set to break even.
Support and Resistance price levels: targets for opening long or short positions. You can place Take Profit levels near them.
Red lines: channels or trend lines that depict the current trend and indicate the preferred trading direction.
The MACD (14,22,3) indicator, encompassing both the histogram and signal line, acts as an auxiliary tool and can also be used as a source of signals.
Important speeches and reports (always noted in the news calendar) can profoundly influence the movement of a currency pair. Hence, trading during their release calls for heightened caution. It may be reasonable to exit the market to prevent abrupt price reversals against the prevailing trend.
Beginners should always remember that not every trade will yield profit. Developing a clear strategy and effective money management is key to success in trading over a long period.
InstaForex analytical reviews will make you fully aware of market trends! Being an InstaForex client, you are provided with a large number of free services for efficient trading.

