 Stay
Stay 
Trading Conditions
Products
Tools


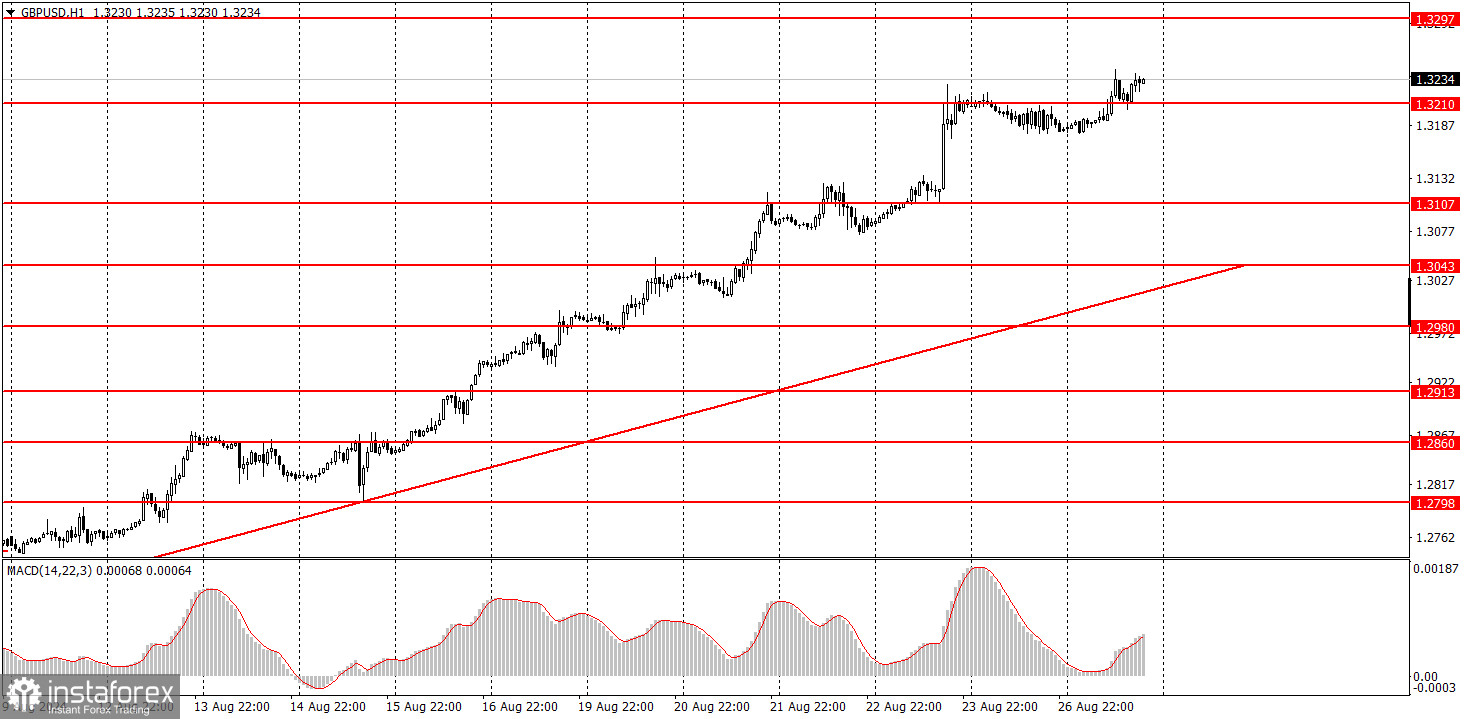
The GBP/USD pair showed an upward movement again on Tuesday. There were no grounds for this movement. Of course, the statements of the Federal Reserve officials suggesting a potential rate cut in September could have become the basis for new dollar sales, but even the euro did not show any growth on Tuesday. Despite everything, the market continues to buy the British pound regardless of circumstances. There is no logic in the current movement, but simultaneously, we are witnessing a strong, almost uninterrupted upward trend. The price is far from the trendline, so almost any correction will not end the uptrend. Although, what kind of correction can we discuss if the pair rises daily?
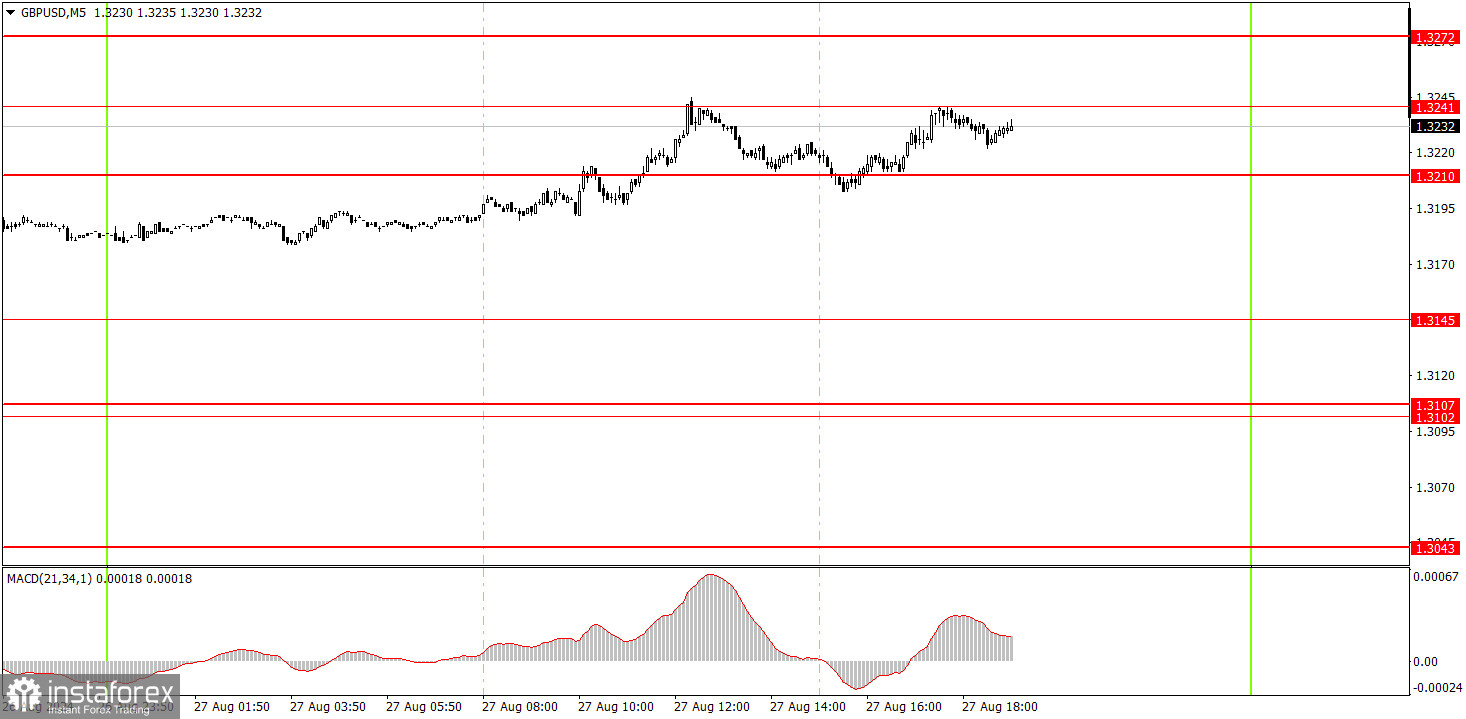
On Tuesday, the price was trapped between the levels of 1.3210 and 1.3241 in the 5-minute time frame, a distance of only 31 pips. Trading between these levels made little sense, and the price bounced off each level throughout the day. Therefore, not a single strong or good trading signal was formed on Tuesday.
In the hourly time frame, GBP/USD has a good chance of resuming the global downward trend, but a strong local uptrend is currently in progress. The British pound remains overbought, the dollar is undervalued, and the market continues to use every opportunity to buy the British currency and sell the dollar. It ignores all unfavorable reports and events. Even if there is no news, the market might continue purchasing the pair.
On Wednesday, the pair might pull back slightly, but the uptrend is unlikely to end soon. However, we wouldn't expect a significant correction at this time. The price bounced off the level of 1.3210 on Monday but showed no inclination to move downward.
The key levels to consider on the 5M timeframe are 1.2605-1.2633, 1.2684-1.2693, 1.2748, 1.2791-1.2798, 1.2848-1.2860, 1.2913, 1.2980-1.2993, 1.3043, 1.3102-1.3107, 1.3145, 1.3210, 1.3241, 1.3272, 1.3310. On Wednesday, no interesting events are scheduled in the UK or the US. Therefore, below the level of 1.3210, you can expect a sluggish downward correction and, above it, a slow continuation of the uptrend.
1) The strength of a signal is determined by the time it takes for the signal to form (bounce or level breakthrough). The less time it took, the stronger the signal.
2) If two or more trades around a certain level are initiated based on false signals, subsequent signals from that level should be ignored.
3) In a flat market, any currency pair can form multiple false signals or none at all. In any case, it's better to stop trading at the first signs of a flat market.
4) Trades should be opened between the start of the European session and midway through the U.S. session. After this period, all trades must be closed manually.
5) In the hourly time frame, trades based on MACD signals are only advisable amidst substantial volatility and an established trend confirmed by a trendline or trend channel.
6) If two levels are too close to each other (5 to 20 pips), they should be considered support or resistance.
7) After moving 20 pips in the intended direction, the Stop Loss should be set to break even.
Support and Resistance price levels: targets for opening long or short positions. You can place Take Profit levels near them.
Red lines: channels or trend lines that depict the current trend and indicate the preferred trading direction.
The MACD (14,22,3) indicator, encompassing both the histogram and signal line, acts as an auxiliary tool and can also be used as a source of signals.
Important speeches and reports (always noted in the news calendar) can profoundly influence the movement of a currency pair. Hence, trading during their release calls for heightened caution. It may be reasonable to exit the market to prevent abrupt price reversals against the prevailing trend.
Beginners should always remember that not every trade will yield profit. Developing a clear strategy and effective money management is key to success in trading over a long period.
InstaForex analytical reviews will make you fully aware of market trends! Being an InstaForex client, you are provided with a large number of free services for efficient trading.


