 Stay
Stay 
Trading Conditions
Products
Tools


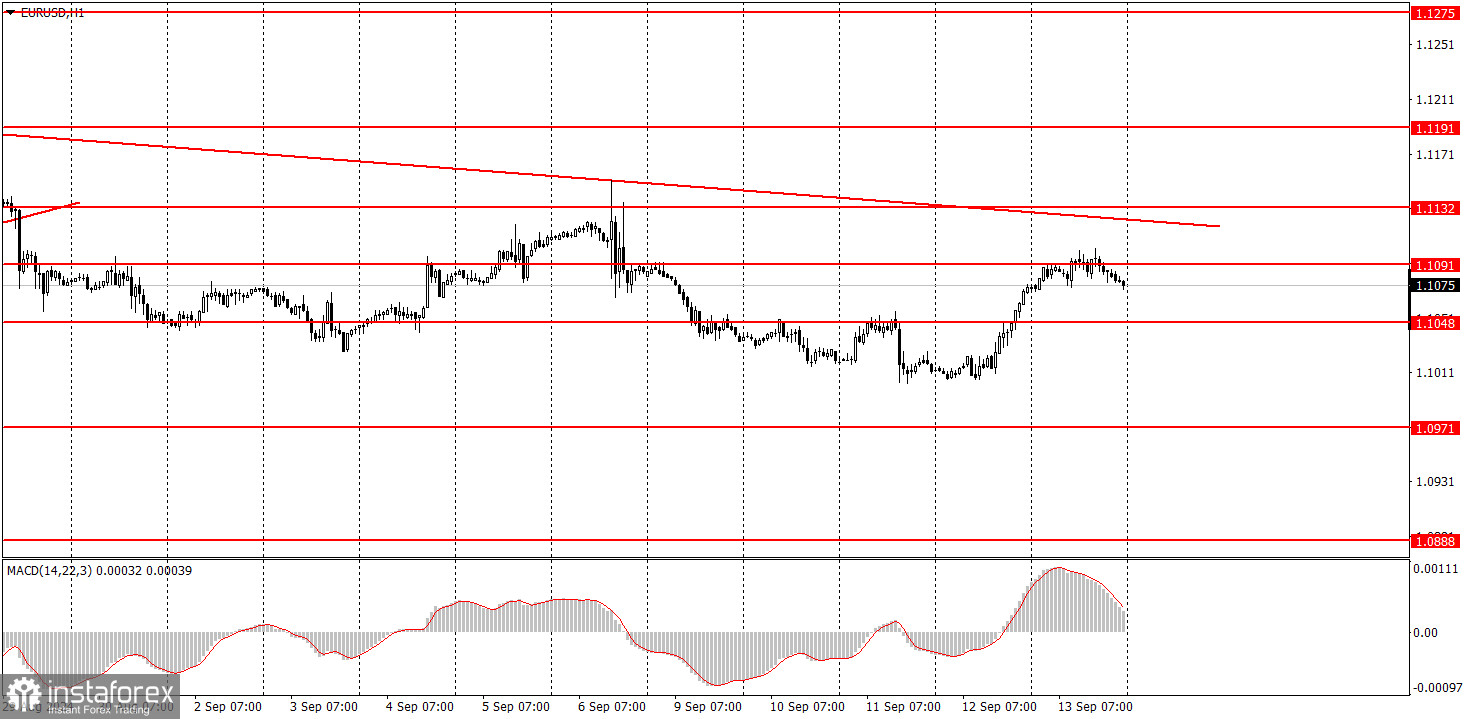
The EUR/USD pair traded in a flat with low volatility on Friday. The market found nothing of interest in the reports on industrial production in the EU and consumer sentiment in the U.S. Most macroeconomic data were mostly ignored. And there was little data to begin with. It's worth highlighting the U.S. inflation report again, which showed a stronger decline than expected yet triggered a rise in the dollar. We should also note the European Central Bank meeting, where rates were lowered, but despite that, the euro rose. As we can see, there was almost no logic in the pair's movements.
The downward trend persists, as indicated by the trend line. However, the euro's downward movement in recent weeks has been very weak so far. We highly doubt that we are witnessing the start of a new downtrend. Although the trend line suggests a sustained decline, it seems that this fall won't last long.
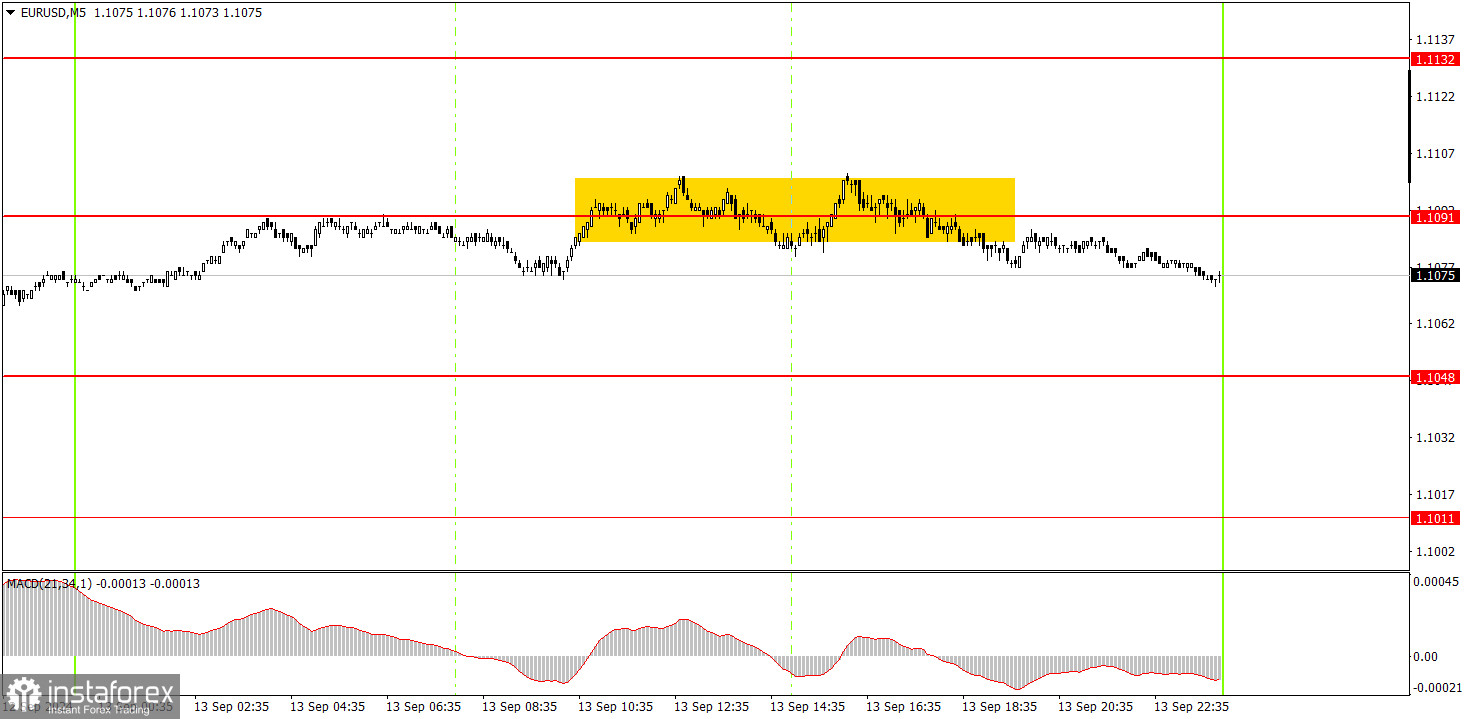
One trading signal was technically formed in the 5-minute time frame on Friday. However, the price traded sideways all day. A significant downside of flat trading in any form is the complete disregard for levels and other technical indicators. This was also evident on Friday—the 1.1091 level offered neither support nor resistance to the price.
In the hourly time frame, the EUR/USD pair can form a downward trend that would be logical and consistent according to all factors and types of analysis. Unfortunately, illogical dollar sales could quickly resume in the medium term, as no one knows how long the market will continue to price in the Federal Reserve's monetary policy easing. The market continues to price in all future rate cuts by the Fed into the dollar's value while ignoring the ECB's policy easing factor.
On Monday, novice traders can trade from the 1.1091 level. Bouncing off this level will provide selling opportunities, while a breakout will signal buying. However, a flat market is highly likely.
The key levels to consider on the 5M time frame are 1.0726-1.0733, 1.0797-1.0804, 1.0838-1.0856, 1.0888-1.0896, 1.0940, 1.0971, 1.1011, 1.1048, 1.1091, 1.1132, 1.1191, 1.1275-1.1292. No significant reports or events are scheduled in the Eurozone or the U.S. for Monday, so we will likely see another "boring Monday."
1) The strength of a signal is determined by the time it takes for the signal to form (bounce or level breakthrough). The less time it took, the stronger the signal.
2) If two or more trades were opened around any level due to false signals, subsequent signals from that level should be ignored.
3) In a flat market, any currency pair can form multiple false signals or none at all. In any case, it's better to stop trading at the first signs of a flat market.
4) Trades should be opened between the start of the European session and midway through the U.S. session. After this period, all trades must be closed manually.
5) In the hourly time frame, trades based on MACD signals are only advisable amidst good volatility and a trend confirmed by a trendline or trend channel.
6) If two levels are too close to each other (5 to 20 pips), they should be considered a support or resistance area.
7) After moving 15 pips in the intended direction, the Stop Loss should be set to break even.
Support and Resistance price levels: targets for opening long or short positions. You can place Take Profit levels around them.
Red lines: channels or trend lines that depict the current trend and indicate the preferred trading direction.
The MACD indicator (14,22,3): encompassing both the histogram and signal line, acts as an auxiliary tool and can also be used as a source of signals.
Important speeches and reports (always noted in the news calendar) can profoundly influence the movement of a currency pair. Hence, trading during their release calls for heightened caution. It may be reasonable to exit the market to avoid sharp price reversals against the prevailing movement.
For beginners, it's important to remember that not every trade will yield profit. Developing a clear strategy and effective money management is key to success in trading over the long term.
InstaForex analytical reviews will make you fully aware of market trends! Being an InstaForex client, you are provided with a large number of free services for efficient trading.


