 Stay
Stay 
Trading Conditions
Products
Tools


The EUR/USD pair continued trading in turbulent conditions on Thursday. During the night, the price dropped significantly, rose twice as much, fell again, and rose once more. As we warned, the market spent all of Thursday reacting to the results of the Federal Reserve meeting. In addition, around midday, the Bank of England also announced its meeting results, which impacted the euro and market volatility. Therefore, the best action would have been to stay out of the market or only enter on very strong and precise signals.
Generally, the euro rose again, and the dollar fell again, which no longer surprises anyone. Despite the dollar's decline for several days leading up to the Fed meeting, which can be described as "pricing in advance" for the dovish scenario, it also fell after the meeting. As we can see, the dollar is falling under any circumstances, regardless of the factors. It is worth noting that the European Central Bank decided to lower rates last week, which also triggered an increase in the pair's value.
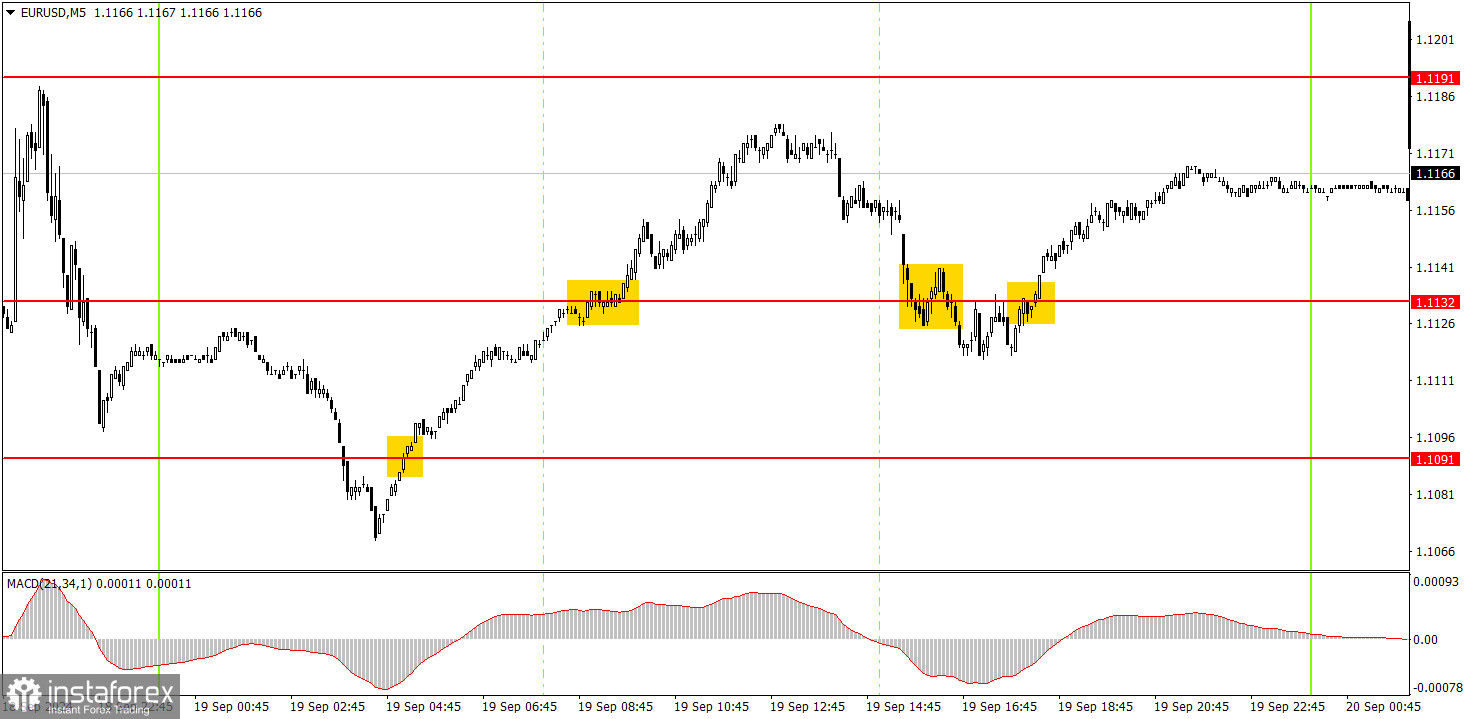
Several trading signals were formed in the 5-minute time frame on Thursday. The first was formed during the night, but it was not actionable. The second, around the 1.1132 level, could have been executed with a long position, but the price did not reach the target level. During the U.S. trading session, two more signals were formed around the 1.1132 level, but they were not precise. The market was still under the influence of the Fed meeting, which explains the erratic "swings" in all directions.
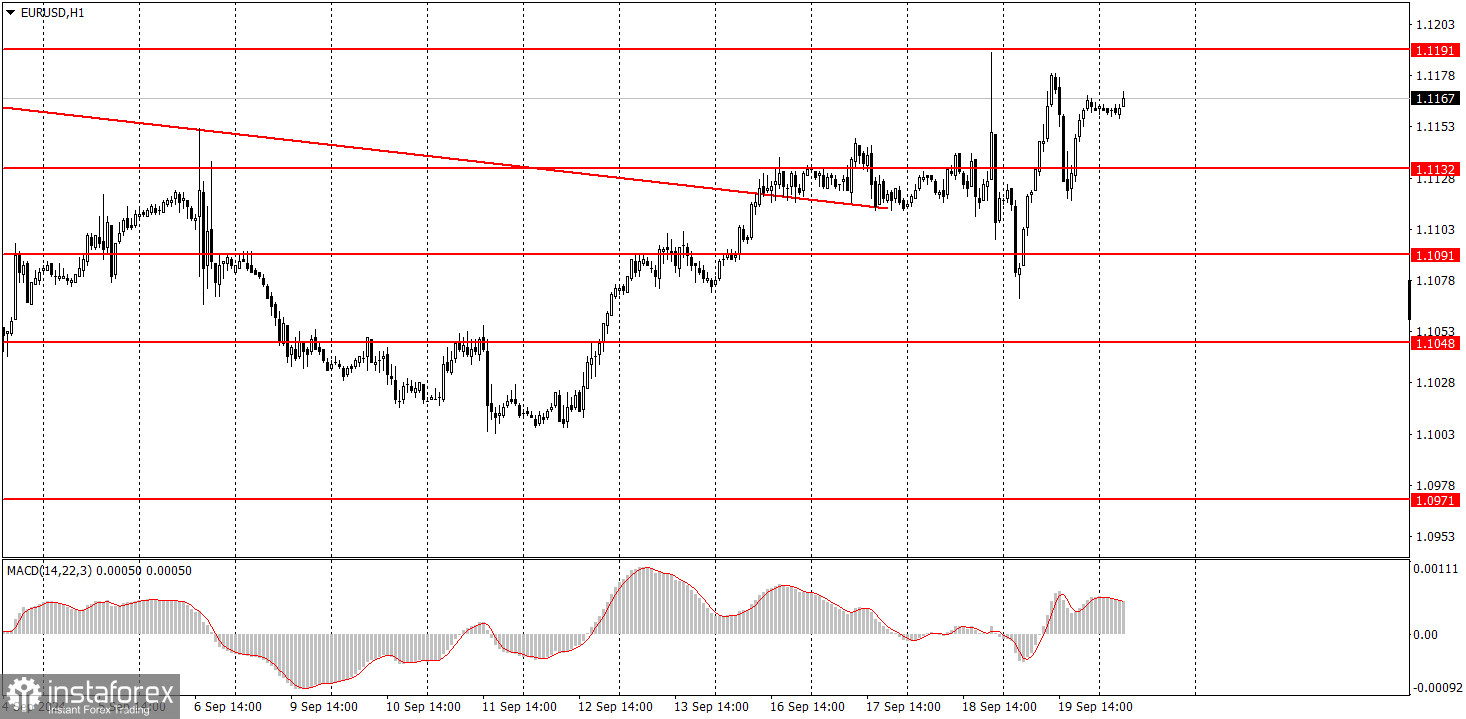
In the hourly time frame, the pair still has a chance to form a downward trend, but those chances are fading. Unfortunately, the irrational selling of the dollar can easily continue in the medium term, as no one knows how much longer the market will be pricing in the Fed's monetary easing while ignoring the ECB's easing. The market continues to factor in all the potential future rate cuts by the Fed, paying no attention to factors that could support the dollar.
By Friday, we can finally say that the market has calmed down, which means movements will be less volatile. We will be able to see how the market is behaving now. If the pair's growth continues, it will indicate that the market focuses solely on selling the dollar.
The key levels to consider on the 5M time frame are 1.0726-1.0733, 1.0797-1.0804, 1.0838-1.0856, 1.0888-1.0896, 1.0940, 1.0971, 1.1011, 1.1048, 1.1091, 1.1132, 1.1191, and 1.1275-1.1292. The only significant event on Friday will be the speech by ECB President Christine Lagarde. However, since the ECB meeting happened last week, she is unlikely to say anything new this week.
1) The strength of a signal is determined by the time it takes for the signal to form (bounce or level breakthrough). The less time it took, the stronger the signal.
2) If two or more trades were opened around any level due to false signals, subsequent signals from that level should be ignored.
3) In a flat market, any currency pair can form multiple false signals or none at all. In any case, it's better to stop trading at the first signs of a flat market.
4) Trades should be opened between the start of the European session and midway through the U.S. session. After this period, all trades must be closed manually.
5) In the hourly time frame, trades based on MACD signals are only advisable amidst good volatility and a trend confirmed by a trendline or trend channel.
6) If two levels are too close to each other (5 to 20 pips), they should be considered a support or resistance area.
7) After moving 15 pips in the intended direction, the Stop Loss should be set to break even.
Support and Resistance price levels: targets for opening long or short positions. You can place Take Profit levels around them.
Red lines: channels or trend lines that depict the current trend and indicate the preferred trading direction.
The MACD indicator (14,22,3): encompassing both the histogram and signal line, acts as an auxiliary tool and can also be used as a source of signals.
Important speeches and reports (always noted in the news calendar) can profoundly influence the movement of a currency pair. Hence, trading during their release calls for heightened caution. It may be reasonable to exit the market to avoid sharp price reversals against the prevailing movement.
For beginners, it's important to remember that not every trade will yield profit. Developing a clear strategy and effective money management is key to success in trading over the long term.
InstaForex analytical reviews will make you fully aware of market trends! Being an InstaForex client, you are provided with a large number of free services for efficient trading.


