 Stay
Stay 
Trading Conditions
Products
Tools


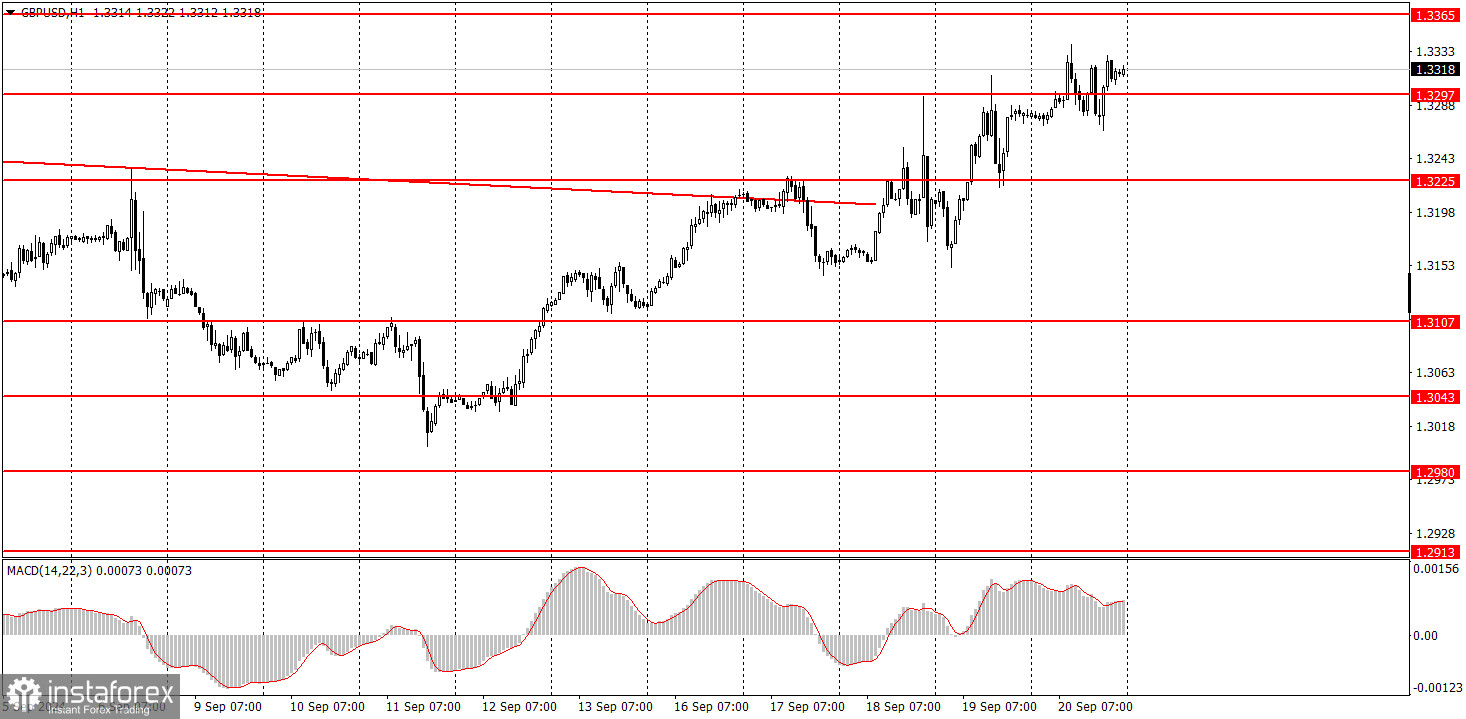
The GBP/USD pair sustained its upward movement on Friday. Retail sales in the UK for August exceeded expert forecasts, providing the market another reason to buy the pound. However, it's been doing just fine without any specific reasons. Last week, the Federal Reserve decided to lower the key interest rate by 0.5%, while the Bank of England kept its rate at 5%. As a result, both meetings could be interpreted in favor of the British pound, which the market did successfully. The dollar continues to fall for any reasons.
The trend has shifted upward in the hourly time frame. Therefore, traders can expect growth in the near term for technical reasons. There have been no fundamental or macroeconomic grounds for the rise of the British currency for a long time, but the market continues to move upward by momentum, still riding on the factor of the Fed's monetary policy easing. All other factors are irrelevant.
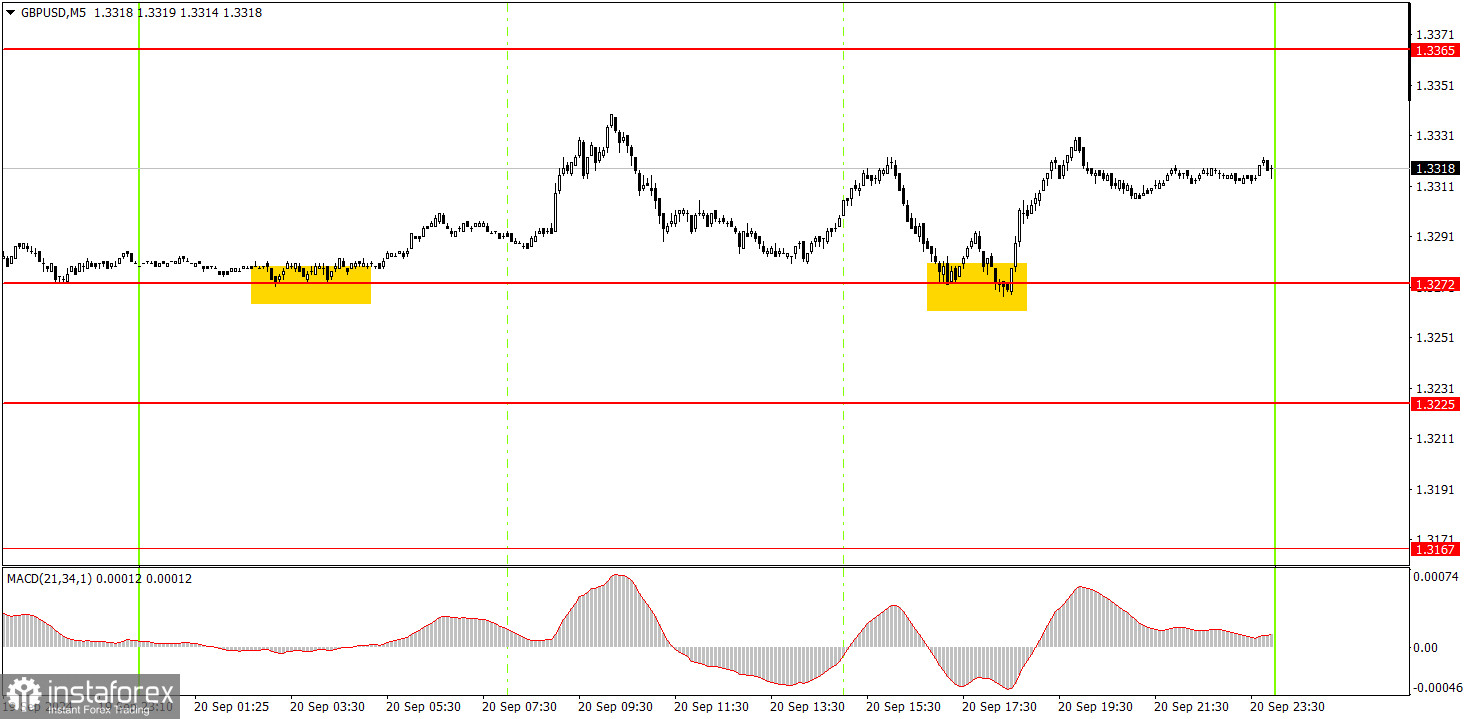
Two buy signals were formed in the 5-minute time frame on Friday. During the night, the price bounced off the 1.3272 level, and it did so again during the U.S. session. The only level above was 1.3365, which was quite a distant target since the pound hadn't traded at such high levels for 2-3 years. Both trades could have made a decent profit, but they should have been closed manually.
The GBP/USD pair has been "struggling" for several weeks, trying to correct at least slightly in the hourly time frame. It didn't succeed. As a result, the market decided to first react to the BoE and Fed meetings in advance and then once again. Thus, the British pound is rising again, and the market still ignores the factors supporting the dollar. How long this movement, which nobody can fully explain, will continue remains unknown.
On Monday, the British pound might continue its upward movement because what would stop it? The market keeps buying, so the pound has no reason to fall. There aren't any levels close to the current price, so trading signals are unlikely to be formed.
In the 5-minute time frame, you can currently trade around the levels of 1.2848-1.2860, 1.2913, 1.2980-1.2993, 1.3043, 1.3102-1.3107, 1.3145-1.3167, 1.3225, 1.3272, 1.3365, and 1.3417. On Monday, the UK and the U.S. will release the September PMI indices for services and manufacturing. These are not crucial data; the market is currently focused only on buying. It is unlikely that these reports will significantly impact the overall market sentiment.
1) The strength of a signal is determined by the time it takes for the signal to form (bounce or level breakthrough). The less time it took, the stronger the signal.
2) If two or more trades were opened around any level due to false signals, subsequent signals from that level should be ignored.
3) In a flat market, any currency pair can form multiple false signals or none at all. In any case, it's better to stop trading at the first signs of a flat market.
4) Trades should be opened between the start of the European session and midway through the U.S. session. After this period, all trades must be closed manually.
5) In the hourly time frame, trades based on MACD signals are only advisable amidst good volatility and a trend confirmed by a trendline or trend channel.
6) If two levels are too close to each other (5 to 20 pips), they should be considered a support or resistance area.
7) After moving 20 pips in the intended direction, the Stop Loss should be set to break even.
Support and Resistance price levels: targets for opening long or short positions. You can place Take Profit levels around them.
Red lines: channels or trend lines that depict the current trend and indicate the preferred trading direction.
The MACD indicator (14,22,3): encompassing both the histogram and signal line, acts as an auxiliary tool and can also be used as a source of signals.
Important speeches and reports (always noted in the news calendar) can profoundly influence the movement of a currency pair. Hence, trading during their release calls for heightened caution. It may be reasonable to exit the market to avoid sharp price reversals against the prevailing movement.
For beginners, it's important to remember that not every trade will yield profit. Developing a clear strategy and effective money management is key to success in trading over the long term.
InstaForex analytical reviews will make you fully aware of market trends! Being an InstaForex client, you are provided with a large number of free services for efficient trading.


