 Stay
Stay 
Trading Conditions
Products
Tools


The GBP/USD pair traded in an exemplary manner on Monday. In the sense that it once again managed to rise despite a macroeconomic backdrop that favored the dollar. Alternatively, one could say that the British pound fell only to grow twice as much a couple of hours later. Both British business activity indices turned out weaker than expected, although they weren't disastrous. The pound's decline also began an hour before the release of these reports, which raised some suspicions. Then, without even waiting for the US data, the market started to buy pounds and sell dollars en masse again, leading to a much more substantial rise than the morning drop. As a result, the British currency rose once more by the end of the day. The US business activity indices were mixed: the services sector index exceeded expectations, while the manufacturing sector index fell short. Therefore, it's hard to say that these reports triggered the dollar's decline.
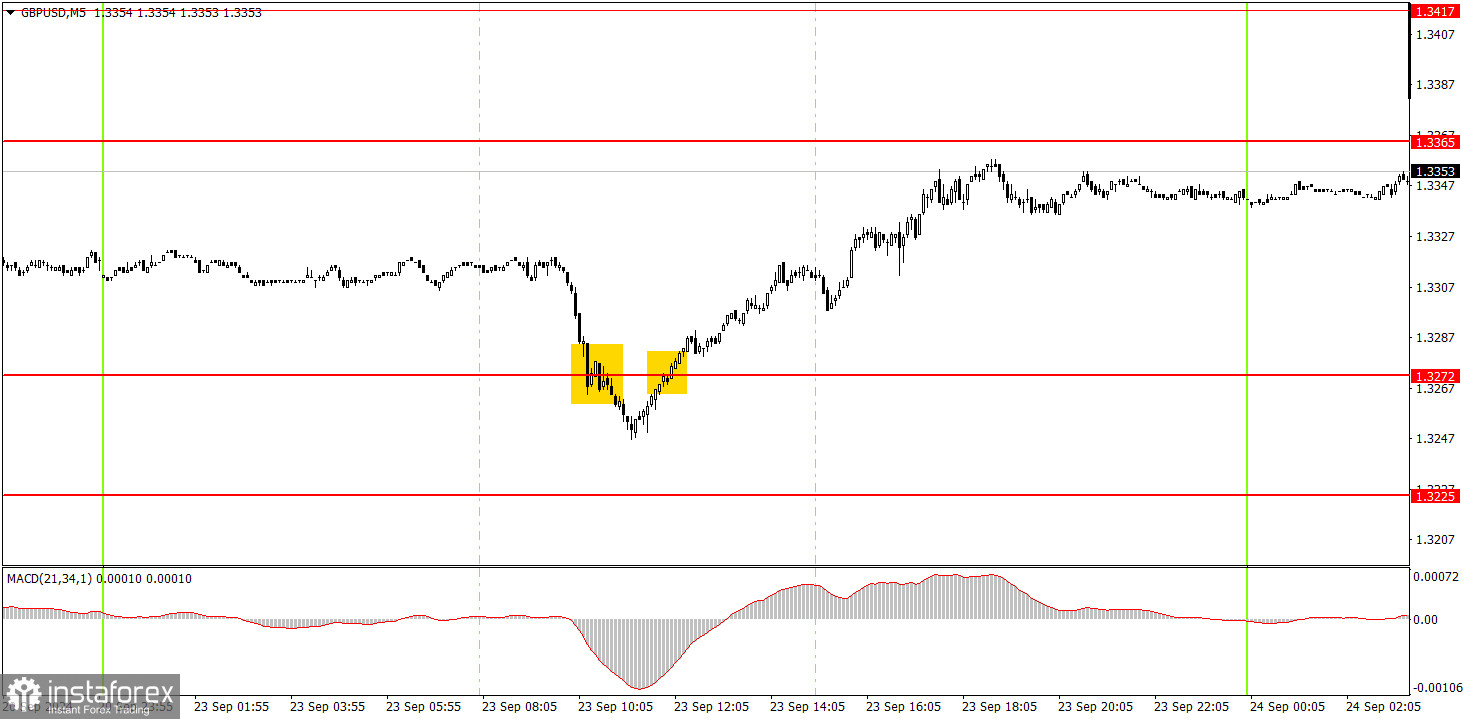
Two trading signals were formed around the 1.3272 level in the 5-minute time frame on Monday. Initially, the pair consolidated below this level, and traders could have reasonably expected a further decline, given that the pound was overbought and the British data were weak. However, as usual, there was no further decline. A reversal occurred out of nowhere, and the pound shot up once more. The second buy signal was profitable and covered the loss from the first trade.
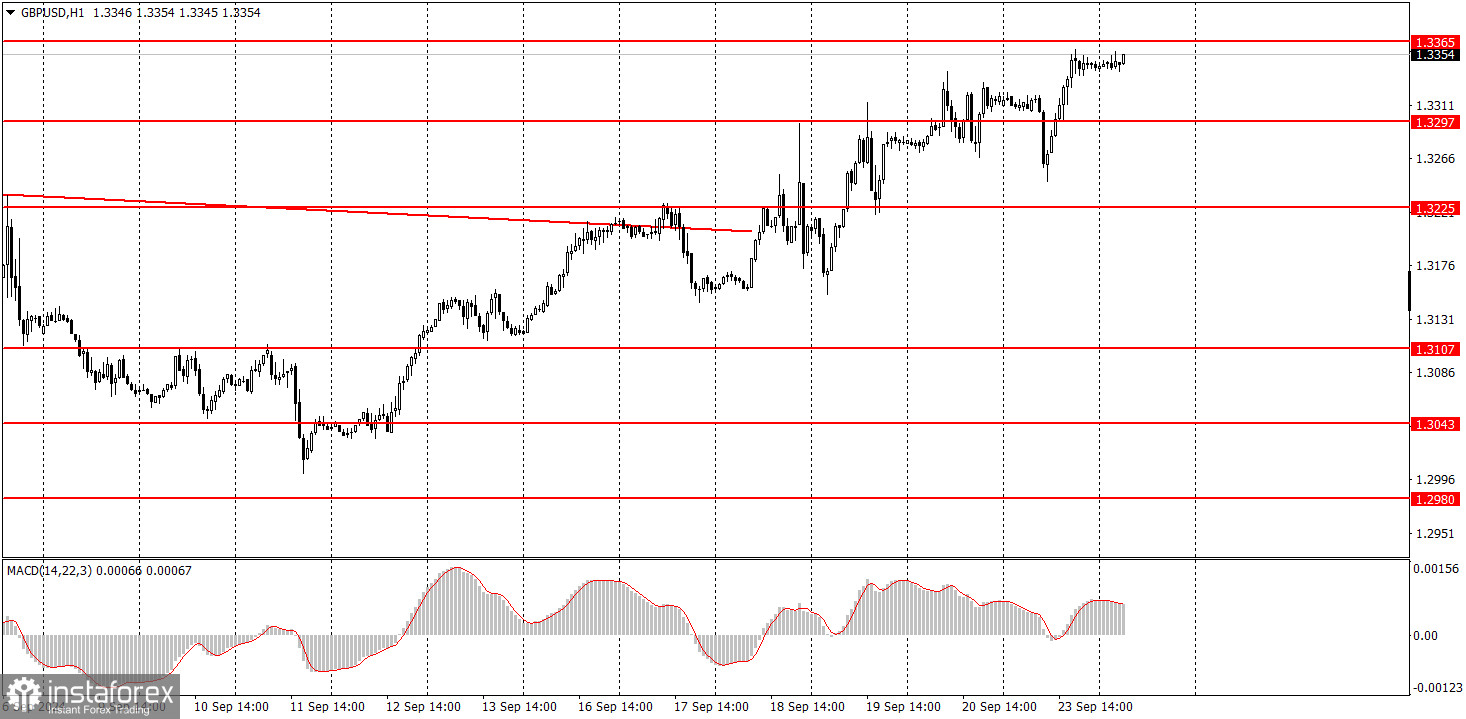
In the hourly time frame, the GBP/USD pair spent several weeks in a "struggle," attempting to correct even slightly. It didn't work out. As a result, the market decided to first react to the Bank of England and Federal Reserve meetings in advance and then again afterward. Consequently, the pound sterling is rising again, and the market continues ignoring factors supporting the dollar. How long this inexplicable movement will continue is still unknown.
On Tuesday, the pound sterling might continue its upward movement because what could stop it? The market keeps buying, so what reasons are there for the pound to fall? The nearest resistance level is 1.3365, but there are doubts that this level will halt the growth.
In the 5-minute time frame, you can currently trade around the levels of 1.2848-1.2860, 1.2913, 1.2980-1.2993, 1.3043, 1.3102-1.3107, 1.3145-1.3167, 1.3225, 1.3272, 1.3365, and 1.3417. No significant events are scheduled for Tuesday in the UK and the US, so substantial movements during the day are not expected. However, the pound may continue to rise even without macroeconomic support.
1) The strength of a signal is determined by the time it takes for the signal to form (bounce or level breakthrough). The less time it took, the stronger the signal.
2) If two or more trades were opened around any level due to false signals, subsequent signals from that level should be ignored.
3) In a flat market, any currency pair can form multiple false signals or none at all. In any case, it's better to stop trading at the first signs of a flat market.
4) Trades should be opened between the start of the European session and midway through the U.S. session. After this period, all trades must be closed manually.
5) In the hourly time frame, trades based on MACD signals are only advisable amidst good volatility and a trend confirmed by a trendline or trend channel.
6) If two levels are too close to each other (5 to 20 pips), they should be considered a support or resistance area.
7) After moving 20 pips in the intended direction, the Stop Loss should be set to break even.
Support and Resistance price levels: targets for opening long or short positions. You can place Take Profit levels around them.
Red lines: channels or trend lines that depict the current trend and indicate the preferred trading direction.
The MACD indicator (14,22,3): encompassing both the histogram and signal line, acts as an auxiliary tool and can also be used as a source of signals.
Important speeches and reports (always noted in the news calendar) can profoundly influence the movement of a currency pair. Hence, trading during their release calls for heightened caution. It may be reasonable to exit the market to avoid sharp price reversals against the prevailing movement.
For beginners, it's important to remember that not every trade will yield profit. Developing a clear strategy and effective money management is key to success in trading over the long term.
InstaForex analytical reviews will make you fully aware of market trends! Being an InstaForex client, you are provided with a large number of free services for efficient trading.


