 Stay
Stay 
Trading Conditions
Products
Tools


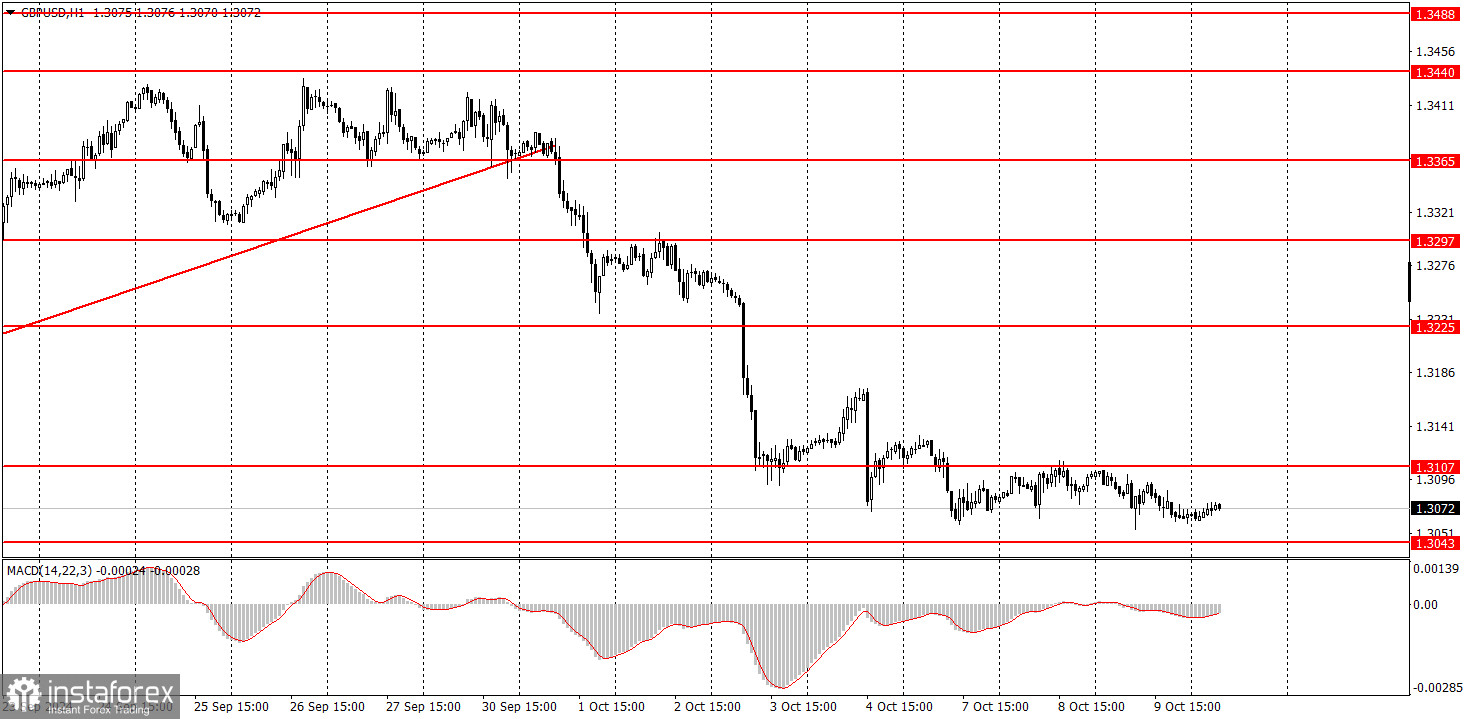
On Wednesday, the GBP/USD pair continued its sluggish downward movement. However, it cannot be considered sluggish in the literal sense, as the price has been falling for nearly two weeks with almost no pauses or corrections. This week's fundamental background is unexciting, and the macroeconomic data is practically absent. As a result, market volatility has sharply decreased. Today, it might increase following the release of the US inflation report, and we might even see a correction. However, since everyone is anticipating a correction, market makers might push the price even lower when no one expects it. Only after that might a correction begin. Essentially, there is not much more to say about the British pound. It remains highly overbought, so we expect only a decline in the medium-term outlook.
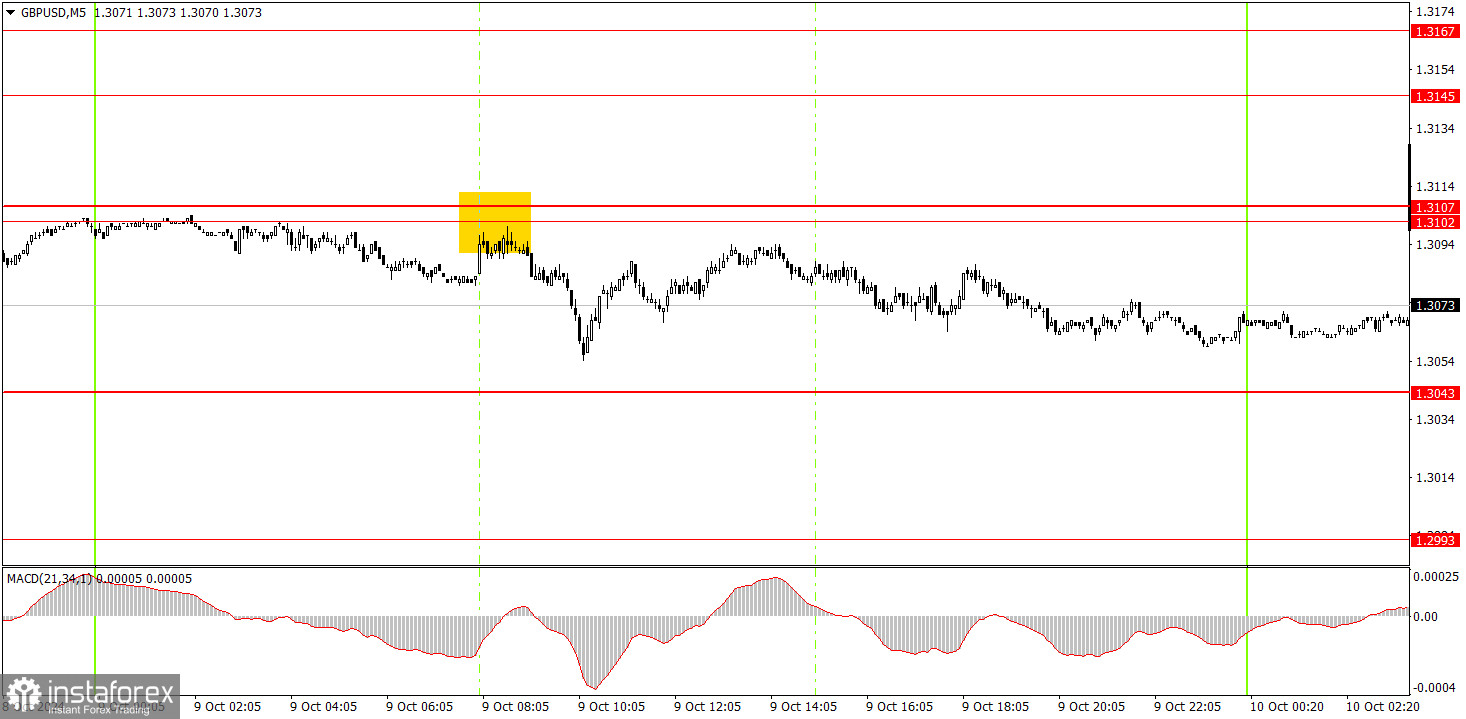
In the 5-minute time frame on Wednesday, a reasonably good sell signal was formed near the 1.3102-1.3107 area. After its formation, the price quickly fell by about 35 pips, recovered during the day, and consolidated until the end. The pair did not reach the target level of 1.3043. Today, movements in various directions are possible during the US trading session.
The GBP/USD pair has broken the upward trend in the hourly time frame. The US dollar has begun its long-awaited growth, but caution is advised when selling, as the pair has not even attempted to correct over the past two weeks, and today is the release of the US inflation report. However, we fully support the pair's decline in the medium term, as we believe it is the only logical scenario.
On Thursday, the British pound may continue its sluggish decline, as it failed to consolidate above the 1.3102-1.3107 area. However, a sharp drop during the US session, followed by an even more substantial rise, which could mark the beginning of a correction, is possible today.
In the 5-minute time frame, you can currently trade using the levels of 1.2913, 1.2980-1.2993, 1.3043, 1.3102-1.3107, 1.3145-1.3167, 1.3225, 1.3272, 1.3365, 1.3428-1.3440, 1.3488, and 1.3537. On Thursday, no significant events are planned in the UK, but the US inflation report will be released, which could trigger movements in different directions over a short period. Be careful.
Support and Resistance Price Levels: These levels serve as targets when opening buy or sell positions. They can also be used as points to set Take Profit levels.
Red Lines: These represent channels or trend lines that display the current trend and indicate the preferred trading direction.
MACD Indicator (14,22,3): The histogram and signal line serve as an auxiliary indicator that can also be used as a source of trading signals.
Important Speeches and Reports (always found in the news calendar) can significantly impact the movement of a currency pair. Therefore, trading should be done with maximum caution during their release, or you may choose to exit the market to avoid a sharp price reversal against the preceding movement.
For Beginners Trading on the Forex Market: It's essential to remember that not every trade will be profitable. Developing a clear strategy and practicing money management is key to achieving long-term success in trading.
InstaForex analytical reviews will make you fully aware of market trends! Being an InstaForex client, you are provided with a large number of free services for efficient trading.

