 Stay
Stay 
Trading Conditions
Products
Tools


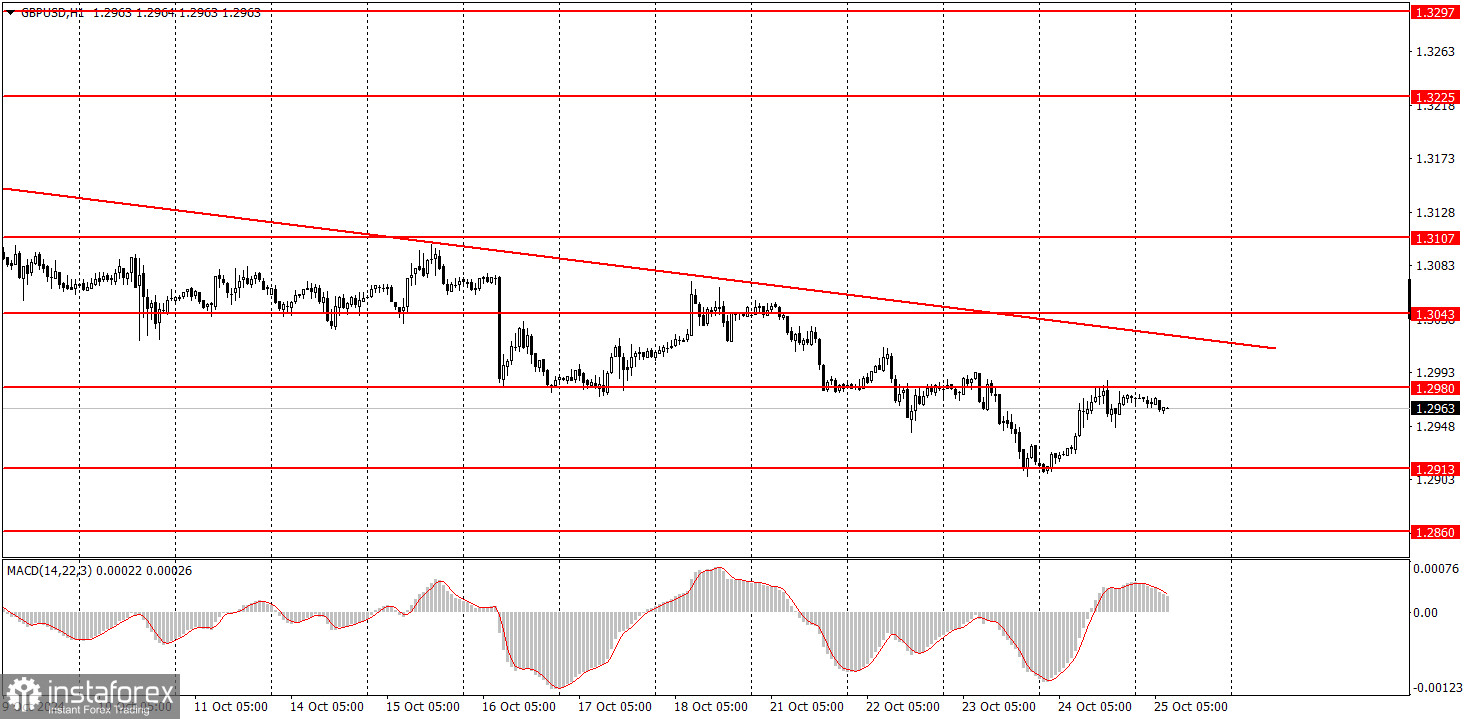
On Thursday, the GBP/USD pair also saw a slight upward correction, but unlike the euro, it failed to break the descending trend line. As a result, the pound's bearish trend remains intact even on the hourly time frame. The British currency had no macroeconomic support yesterday. The services and manufacturing PMIs were weaker than expected, while similar U.S. indices were stronger than forecasts. Thus, it's hard to justify why the pound sterling started to rise.
Nevertheless, the pound, like any currency, cannot fall indefinitely. We may have just seen a simple correction before another drop. In any case, the bearish trend remains unbroken, and in the medium term, we still expect the pair to decline, as the market has already priced in all possible factors that could weaken the U.S. dollar.
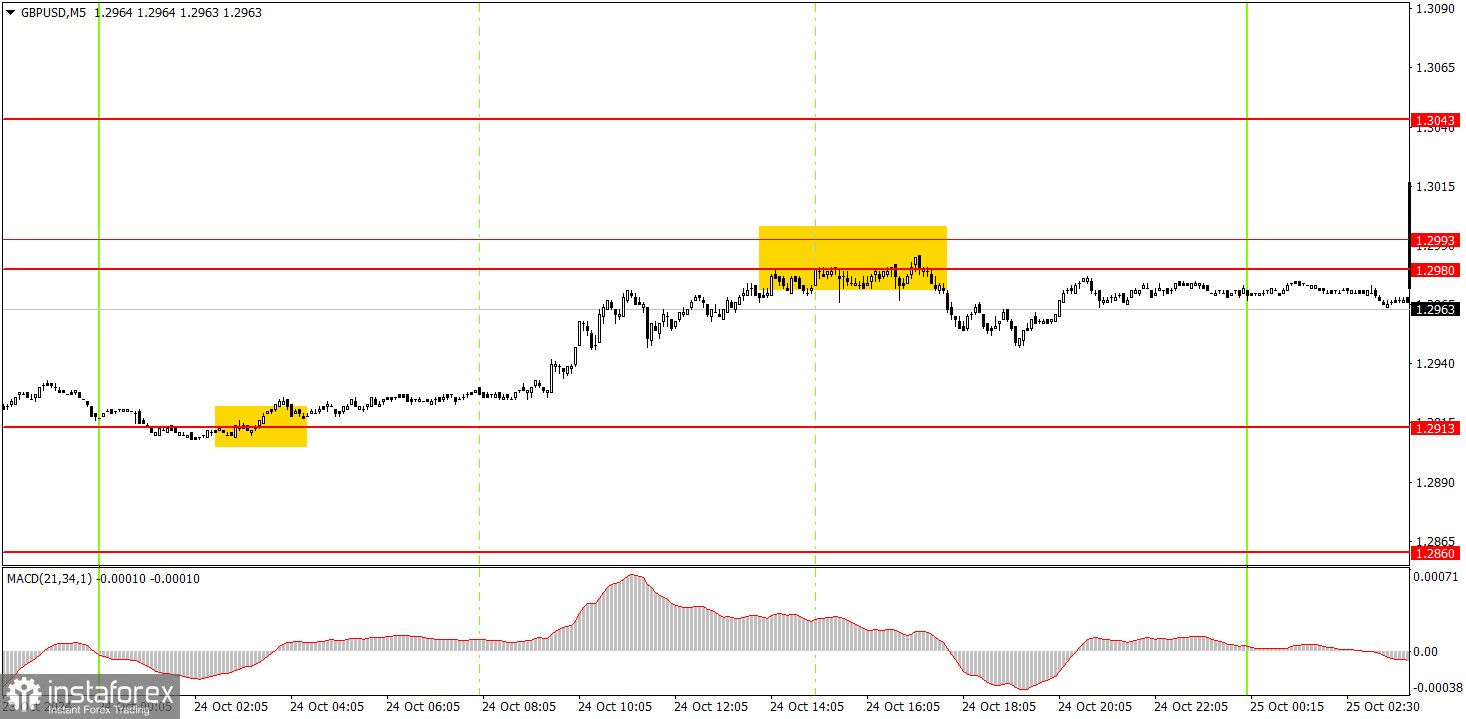
In the 5-minute time frame, two decent signals were formed on Thursday. During the night, the price rebounded from the 1.2913 level, but by the time the European trading session began, the pair had only moved a few pips from the entry point. Therefore, buying positions could have been opened. By the start of the U.S. session, the price reached the 1.2980-1.2993 area and bounced from it. At this point, long positions could have been closed, and short positions could have been opened. Short positions can remain open as long as the price does not break through this area.
In the hourly time frame, GBP/USD broke its upward trend and continued to decline. We fully support the pair's downward movement in the medium term as we believe this is the only logical outcome. The pound may attempt to correct in the near future, but confirmation of this would require at least a break above the trend line. There are no grounds for expecting a strong upward movement for the pound right now.
The pair may resume its downward trend on Friday since the trend line remains unbroken. If the price remains below the trend line, there's no point in considering buying. Any upward move would likely be a correction, even in that case.
In the 5-minute time frame, trades can be made around the levels of 1.2848-1.2860, 1.2913, 1.2980-1.2993, 1.3043, 1.3102-1.3107, 1.3145-1.3167, 1.3225, 1.3272, 1.3365, 1.3428-1.3440. No significant events are scheduled in the UK on Friday, but two crucial reports will be released in the U.S.—the University of Michigan Consumer Sentiment Index and the Durable Goods Orders report.
Support and Resistance Price Levels: These levels serve as targets when opening buy or sell positions. They can also be used as points to set Take Profit levels.
Red Lines: These represent channels or trend lines that display the current trend and indicate the preferred trading direction.
MACD Indicator (14,22,3): The histogram and signal line serve as a supplementary indicator that can also be used as a source of trading signals.
Important Speeches and Reports (always found in the news calendar) can significantly impact the movement of a currency pair. Therefore, trading should be done with maximum caution during their release, or you may choose to exit the market to avoid a sharp price reversal against the preceding movement.
For Beginners Trading on the Forex Market: It's essential to remember that not every trade will be profitable. Developing a clear strategy and practicing money management is key to achieving long-term success in trading.
InstaForex analytical reviews will make you fully aware of market trends! Being an InstaForex client, you are provided with a large number of free services for efficient trading.

