This information is provided to retail and professional clients as part of marketing communication. It does not contain and should not be construed as containing investment advice or investment recommendation or an offer or solicitation to engage in any transaction or strategy in financial instruments. Past performance is not a guarantee or prediction of future performance. Instant Trading EU Ltd. makes no representation and assumes no liability as to the accuracy or completeness of the information provided, or any loss arising from any investment based on analysis, forecast or other information provided by an employee of the Company or otherwise. Full disclaimer is available here.
Analytics today
Popular analytics
If we look at the 4-hour chart of the S&P 500 index, a Bearish 123 pattern appears which is followed by a deviation between the price movement and the Stochastic.
Technical Analysis of Intraday Price Movement of Crude Oil Commodity Asset, Thursday November 14, 2024.
On the 4-hour chart of the Crude Oil commodity asset, there has been a deviation between the price movement and the Stochastic Oscillator indicator, especially with the failure of #CL.
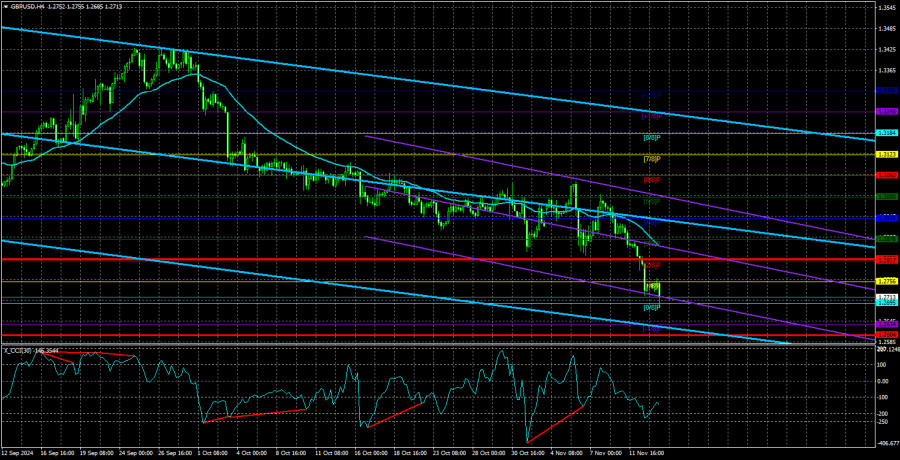
Overview of GBP/USD on November 14; U.S. Inflation Did Not Surprise, Euro and Pound Might See a Minor Correction
The GBP/USD currency pair avoided a fresh decline on Wednesday, but the pause may be short-lived. We previously warned that the increase in U.S. inflation could already be priced.
Overview of EUR/USD on November 14; The Euro's Collapse Continues
The EUR/USD currency pair continued its downward trend on Wednesday. While corrections are possible during any movement, the current overall technical picture is clear. Looking at the weekly timeframe.
Trading Signals for GOLD (XAU/USD) for November 13-14, 2024: buy if breaks $2,613 (3/8 Murray - symmetrical triangle)
In case gold breaks and consolidates above 2,613, the outlook could be positive and gold could reach the 21 SMA area around 2,635 and even the top of the downtrend.
EUR/USD: Simple Trading Tips for Beginner Traders for November 13th (U.S. Session)
The 1.0599 level was tested when the MACD indicator had already moved significantly below the zero line. It remained in the oversold area for an extended period, which limited.
EUR/USD. Analysis and Forecast
For the fourth consecutive day, the EUR/USD pair is trading with a bearish bias, hovering slightly above its lowest level since November 2023. The decline is driven by several factors.
EUR/USD and GBP/USD on November 13 – Technical Analysis
Yesterday, the bears updated the previous day's low and continued their decline. At this stage, the pair strives to overcome the influence and pull of the monthly supports (1.0649 –.
Show more
This section is updated daily and contains market analysis prepared by professional analysts on behalf of InstaForex. Each of the specialists presents analytical reviews in accordance with his/her vision of the current situation on the foreign exchange and other markets. However, the outlooks below are neither recommendations nor instructions to any actions. They contain analysis of the current situation on financial markets. In some cases, analysts' opinions about current market conditions may differ.

 Stay
Stay 


