 Stay
Stay 
Trading Conditions
Products
Tools


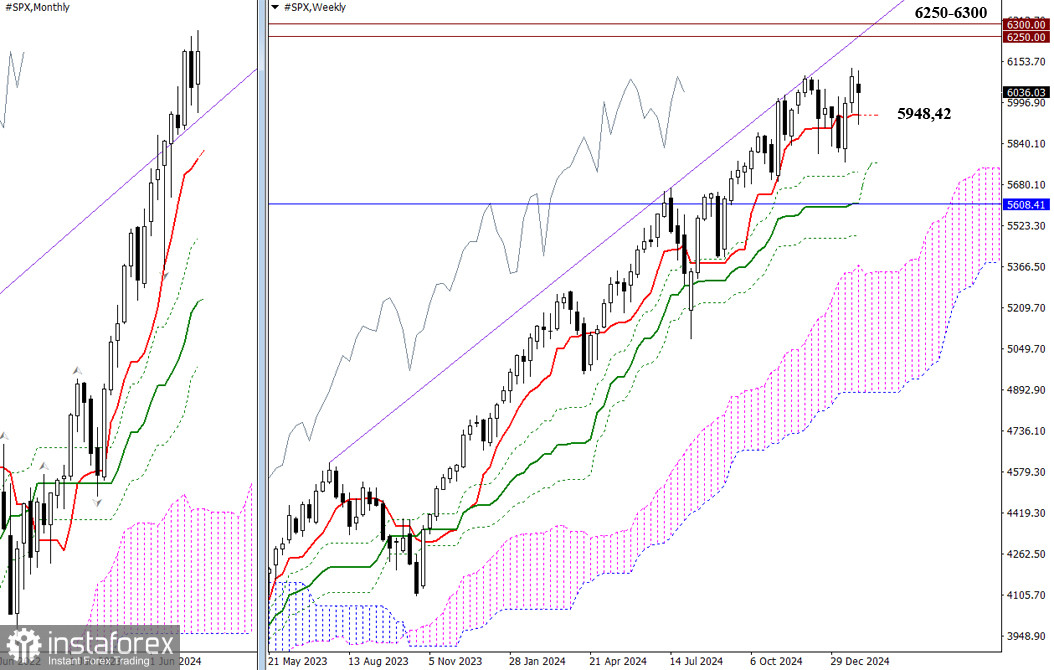
January ended with a bullish candle, establishing a new all-time high at 6127.41. However, the index only reached this high with an upper shadow, failing to close above previous levels. It's worth noting that bears also updated last month's low, and the weekly close before the weekend reflected a dominance of uncertainty. These circumstances open the door for the market to break below the current support at 5948.42 (weekly short-term trend) and initiate a downward correction. If bullish activity resumes, the resistance zone near the psychological levels of 6250 – 6300 remains the primary target.
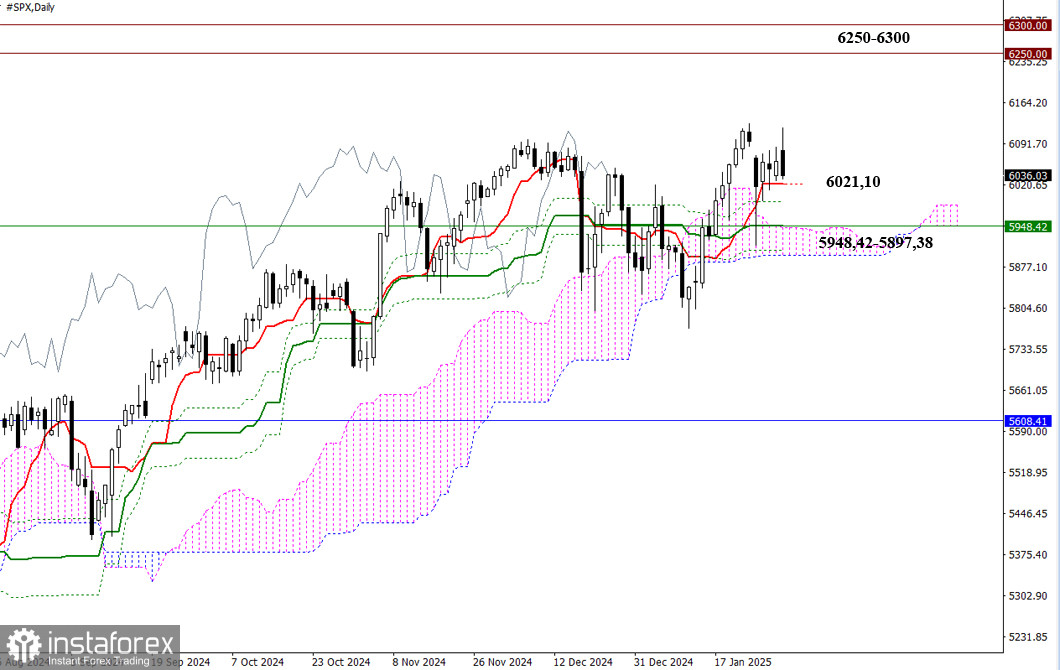
Last week, the index opened with a deep downward gap, which could not be fully closed by the daily candle's body, leaving only a shadow. If the daily short-term trend at 6021.10 ceases to act as support within this consolidation, the next critical levels for bears are 5948.42 (daily medium-term trend + weekly short-term trend) and the daily Ichimoku cloud support between 5943.52 and 5897.38. A break below these levels would create new opportunities for downward movement.
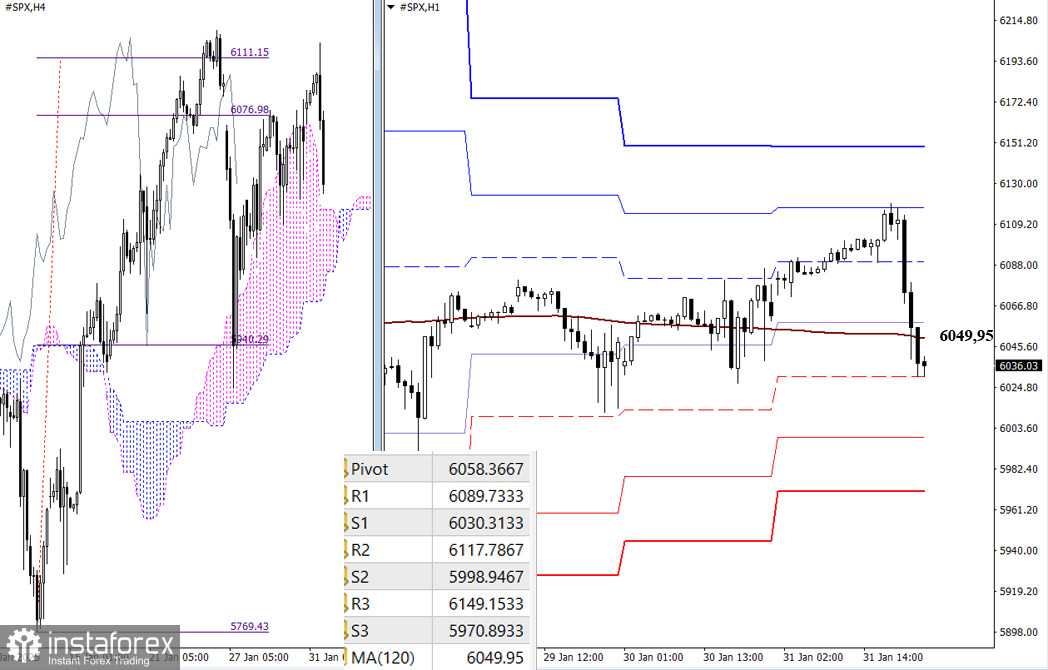
In the H4 timeframe, the bullish target of breaking above the H4 Ichimoku cloud at 6111.15 was achieved by the end of last week. As anticipated, the bulls took a pause afterward. This completed H4 target established a solid basis for a shift in sentiment. The bulls were unable to return to previous highs or continue their upward movement. Currently, the index is trading in a zone of equilibrium near the weekly long-term trend line at 6049.95, which has been moving horizontally for some time, indicating market indecision.
Trading above this trend line would favor a strengthening of bullish sentiment, while trading below it could create opportunities for bearish momentum to develop. The intraday movement will be guided by the classic pivot support and resistance levels, which are updated daily at market open.
***
InstaForex analytical reviews will make you fully aware of market trends! Being an InstaForex client, you are provided with a large number of free services for efficient trading.


