 Stay
Stay 
Trading Conditions
Products
Tools


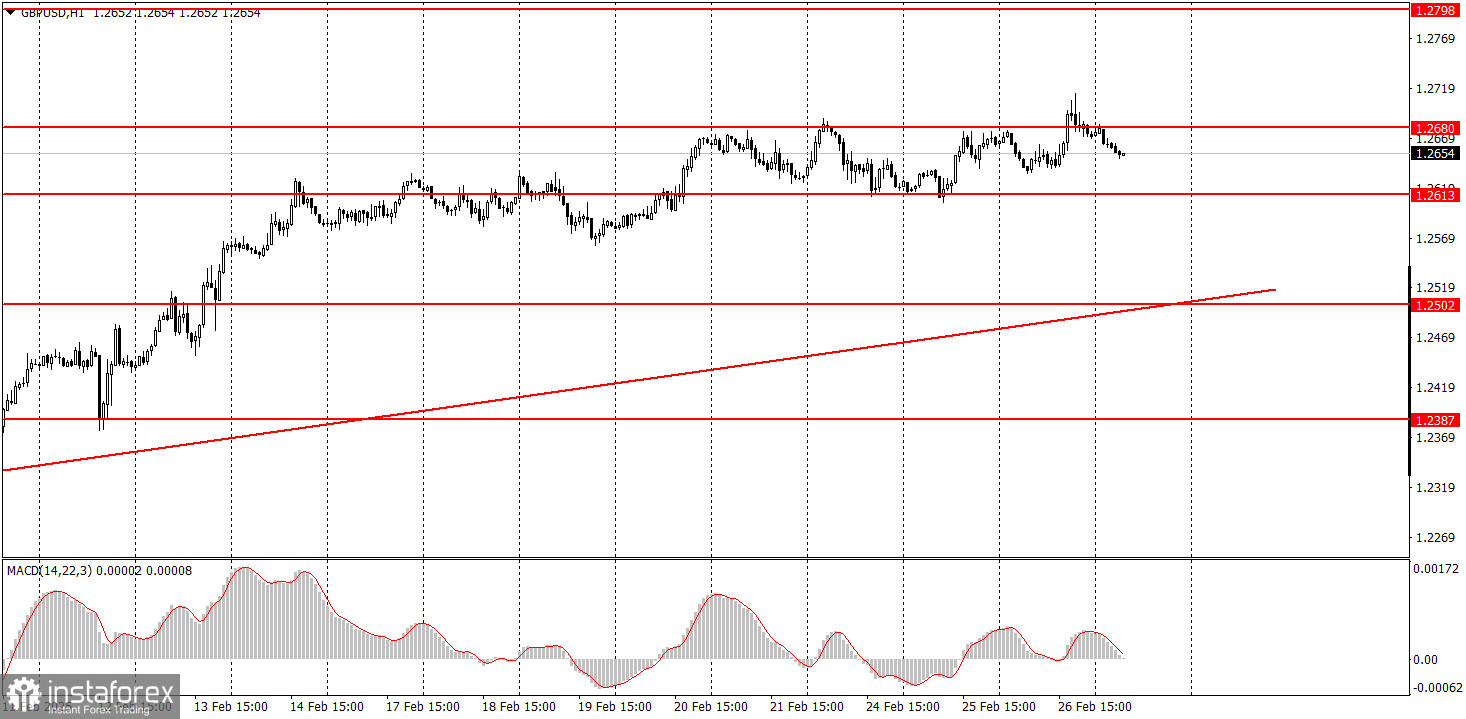
On Wednesday, GBP/USD attempted to continue its upward movement, but this trend is starting to look questionable. Previously, we noted that the pound needed to correct upward on the daily chart due to technical factors. However, its current rise seems excessive and unjustified. While some recent UK economic reports supported the pound, it has remained elevated this week despite the lack of positive news. In fact, there has been no macroeconomic data released at all. This week's movement still reflects a flat, with prices trading between 1.2613 and 1.2680. As expected, there were no significant events in the UK or the U.S. on Wednesday. Additionally, the market is no longer responding to Donald Trump's statements, as it has grown weary of them.
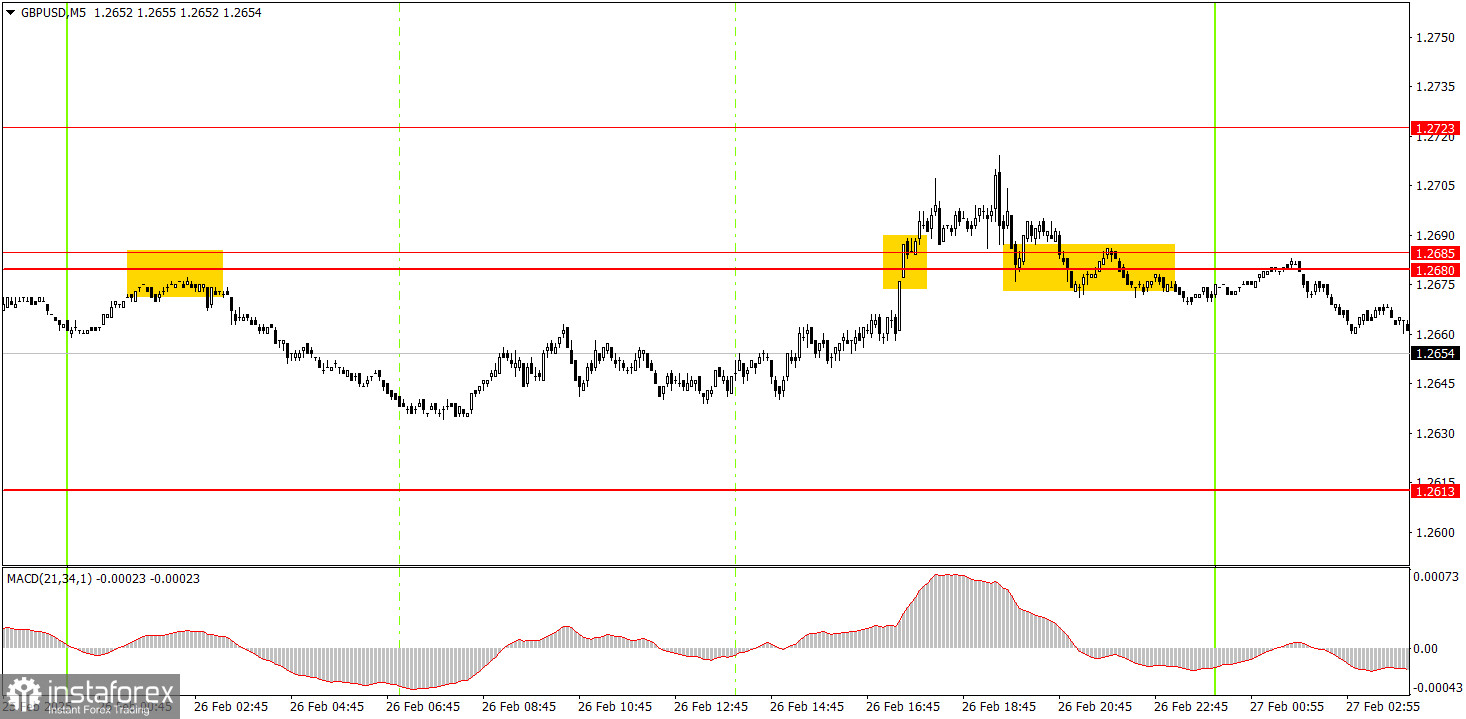
On the 5-minute chart, we observed sharp movements within a stagnant market. Despite the flat range on the 1-hour timeframe, noticeable price swings occurred on the 5-minute chart. Most signals were generated around the 1.2680-1.2685 area. The price initially rebounded from this level, then experienced a false breakout, but later confirmed a consolidation below. Although none of these movements reached their next target levels, they also did not result in losses, as the pound moved at least 20 pips in the expected direction each time.
In the hourly timeframe, GBP/USD may start a short-term downtrend, but all movements over the past few weeks represent a correction in the daily chart. We still expect the pound to decline toward 1.1800 in the medium term, as this remains the most logical scenario. Therefore, the key is waiting for the upward correction to end on the daily timeframe.
On Thursday, GBP/USD could begin a new downward cycle since the pound has gained significantly in recent weeks and has been stagnating in a tight range for several days. The short-term uptrend remains intact, but we have mainly seen a flat phase this week. Wednesday already showed a false attempt to continue the uptrend.
On the 5-minute chart, key levels to watch are 1.2164-1.2170, 1.2241-1.2270, 1.2301, 1.2372-1.2387, 1.2445, 1.2502-1.2508, 1.2547, 1.2613, 1.2680-1.2685, 1.2723, and 1.2791-1.2798. The UK has no scheduled economic events on Thursday, while the U.S. will finally release its first significant reports of the week, including Q4 GDP and durable goods orders. This may bring an end to the current flat market conditions.
Support and Resistance Levels: These are target levels for opening or closing positions and can also serve as points for placing Take Profit orders.
Red Lines: Channels or trendlines indicating the current trend and the preferred direction for trading.
MACD Indicator (14,22,3): A histogram and signal line used as a supplementary source of trading signals.
Important Events and Reports: Found in the economic calendar, these can heavily influence price movements. Exercise caution or exit the market during their release to avoid sharp reversals.
Forex trading beginners should remember that not every trade will be profitable. Developing a clear strategy and practicing proper money management are essential for long-term trading success.
InstaForex analytical reviews will make you fully aware of market trends! Being an InstaForex client, you are provided with a large number of free services for efficient trading.


