 Stay
Stay 
Trading Conditions
Products
Tools


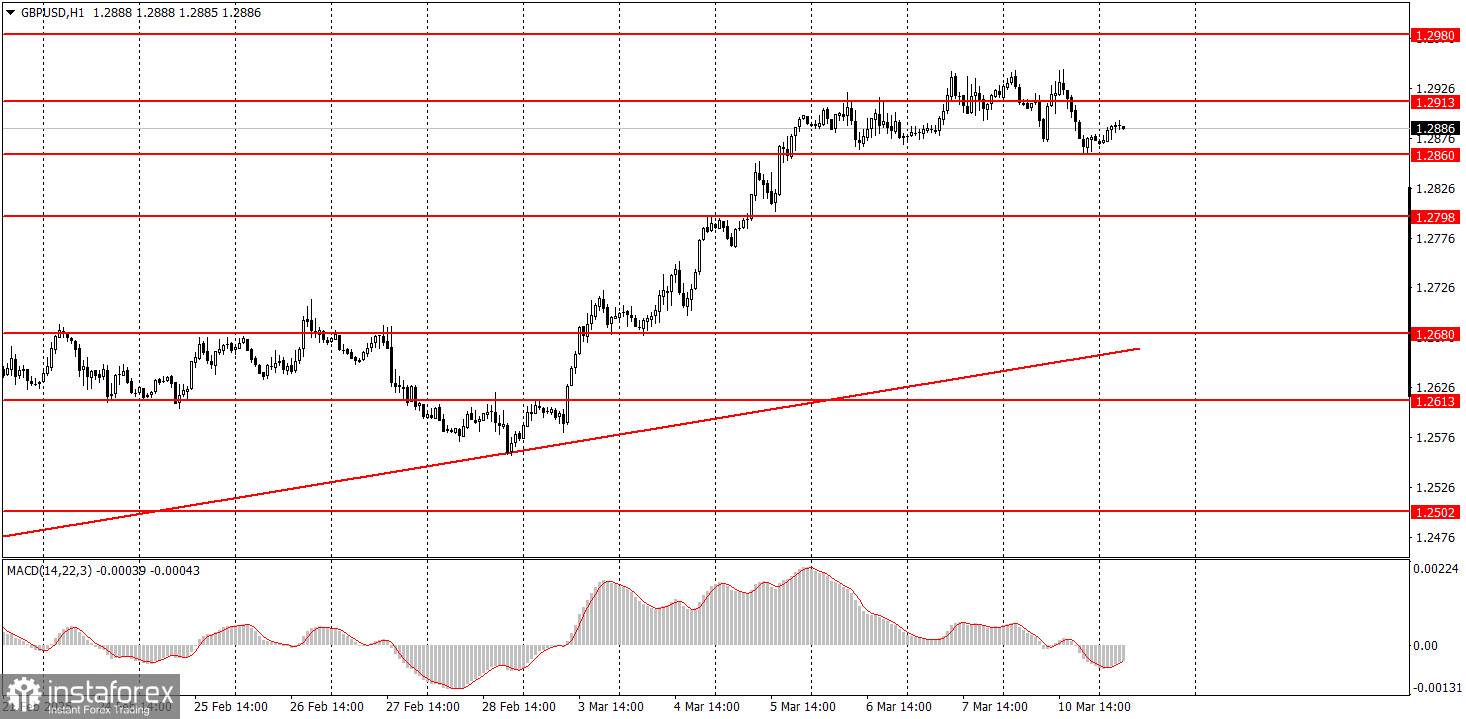
On Monday, the British pound attempted to continue its upward movement before reversing lower, ultimately remaining in a sideways range similar to the last two days of the previous week. We are witnessing a flat market at local highs. The market appears to be waiting for new statements from Trump, U.S. inflation data, or another key event. The impact of Trump's tariffs on the U.S. economy has been fully priced in, but what will drive further euro and pound growth?
As we mentioned last week, while Trump's policies have created challenges for the U.S. economy, they remain much stronger than the European or British economies. If Trump imposes tariffs on the EU or the UK, their economies will also slow under the pressure of a trade war. It is incorrect to assume that only the U.S. will suffer. Additionally, the U.S. dollar remains the world's reserve currency, making it unlikely to fall indefinitely.
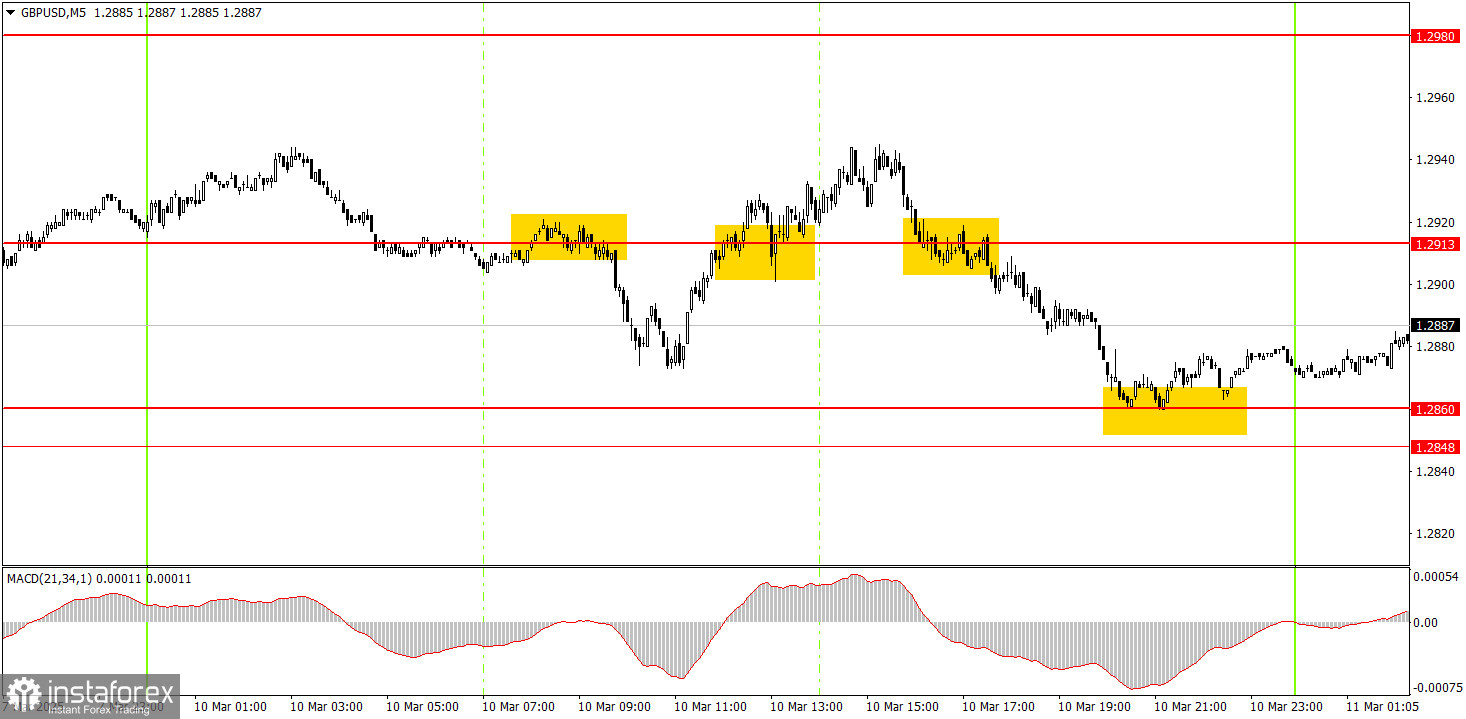
On the 5-minute chart, several trading signals appeared on Monday, but most were weak due to sideways movement. The first two signals near the 1.2913 level turned out to be false, as the nearest targets were not reached. However, these trades did not result in significant losses, as the price moved at least 20 pips in the correct direction before reversing.
In the hourly timeframe, GBP/USD could start a short-term downtrend, but Trump's actions prevent this. In the medium term, we still expect the pound to decline toward 1.1800, which is the most logical outcome. However, we must wait for the completion of the daily timeframe's upward correction and assess when and how it concludes. It is also important to recognize that the dollar risks breaking its 16-year upward trend.
On Tuesday, GBP/USD could continue rising if Donald Trump continues to disrupt global markets with his policies. However, if Trump does not make any destabilizing announcements, a correction is the most logical scenario.
Key levels for trading on the 5-minute timeframe include 1.2301, 1.2372-1.2387, 1.2445, 1.2502-1.2508, 1.2547, 1.2613, 1.2680-1.2685, 1.2723, 1.2791-1.2798, 1.2848-1.2860, 1.2913, 1.2980-1.2993, and 1.3043. There are no major scheduled events in the UK or the U.S. on Tuesday, but Trump remains active. The JOLTs report might trigger a minor market reaction, but it is unlikely to significantly impact.
Support and Resistance Levels: These are target levels for opening or closing positions and can also serve as points for placing Take Profit orders.
Red Lines: Channels or trendlines indicating the current trend and the preferred direction for trading.
MACD Indicator (14,22,3): A histogram and signal line used as a supplementary source of trading signals.
Important Events and Reports: Found in the economic calendar, these can heavily influence price movements. Exercise caution or exit the market during their release to avoid sharp reversals.
Forex trading beginners should remember that not every trade will be profitable. Developing a clear strategy and practicing proper money management are essential for long-term trading success.
InstaForex analytical reviews will make you fully aware of market trends! Being an InstaForex client, you are provided with a large number of free services for efficient trading.


