 Stay
Stay 
Trading Conditions
Products
Tools


The EUR/USD currency pair continued to trade higher on Monday but within a confined range that can be considered a sideways channel. Traders again ignored all news supporting the U.S. dollar, even though there were only a few such reports. The U.S. retail sales report showed a 1% month-over-month increase, far exceeding the forecast of 0.2%. While the previous month's figure was revised downward, the gap between February's actual and forecast values was still much more favorable for the dollar than data from two months ago. Therefore, the dollar had an opportunity to strengthen on the first trading day of the week, but it failed to do so again. The market refuses to buy the dollar, ignores any events that support it and focuses solely on Donald Trump.
It would not be surprising if the EUR/USD pair resumes its growth at this point. However, after a strong upward movement, the pair has not even attempted a slight downward correction. There is still a chance for a pullback from the 1.0935 level, which could keep the price within the sideways channel for a while. Later, we might see a downward correction.
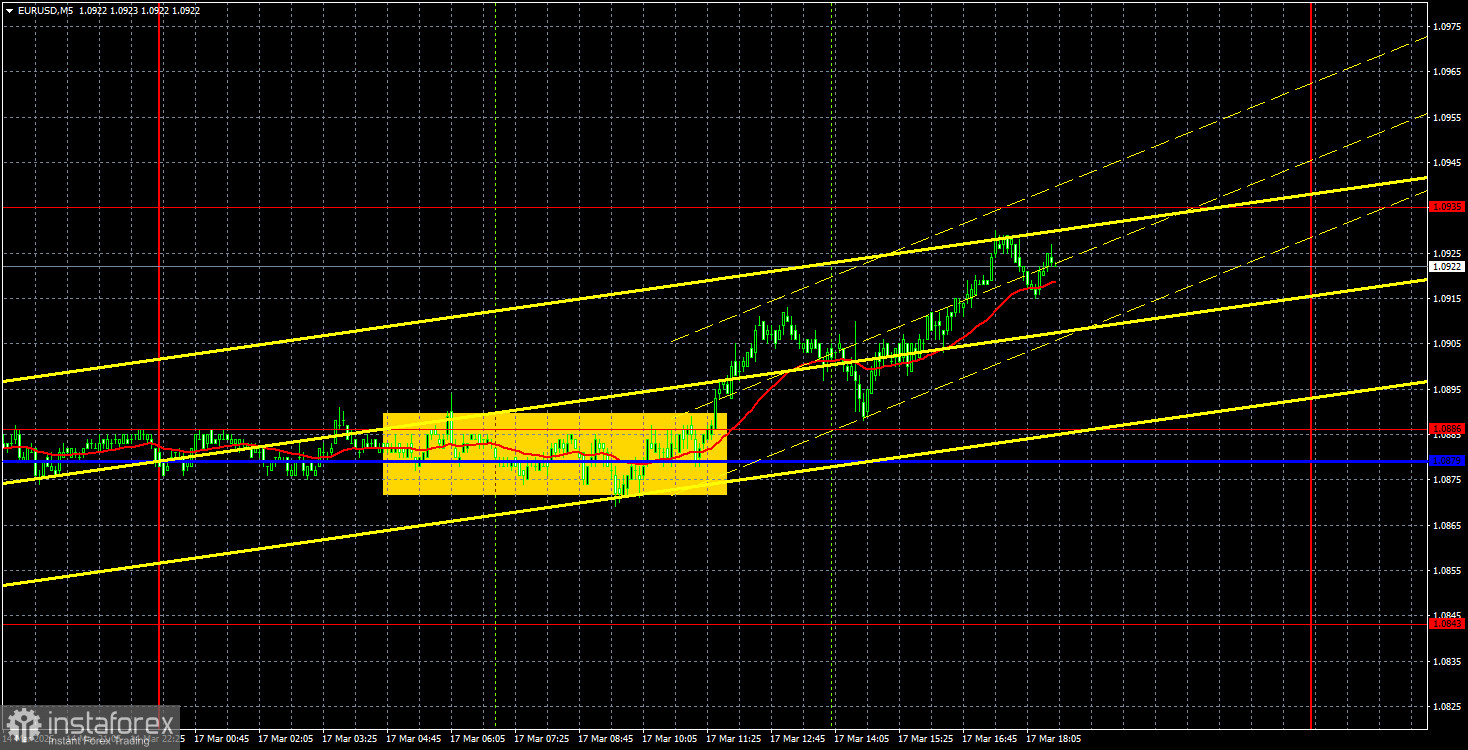
In the 5-minute timeframe, it is clear that the pair remained stagnant for most of the day. Growth only started closer to the U.S. trading session. A selling signal emerged in the 1.0879–1.0886 area, but it was false. However, the next buy signal was accurate, and by the end of the day, the price had almost reached the nearest target at 1.0935. Volatility was not very high, but a small profit could still be made.
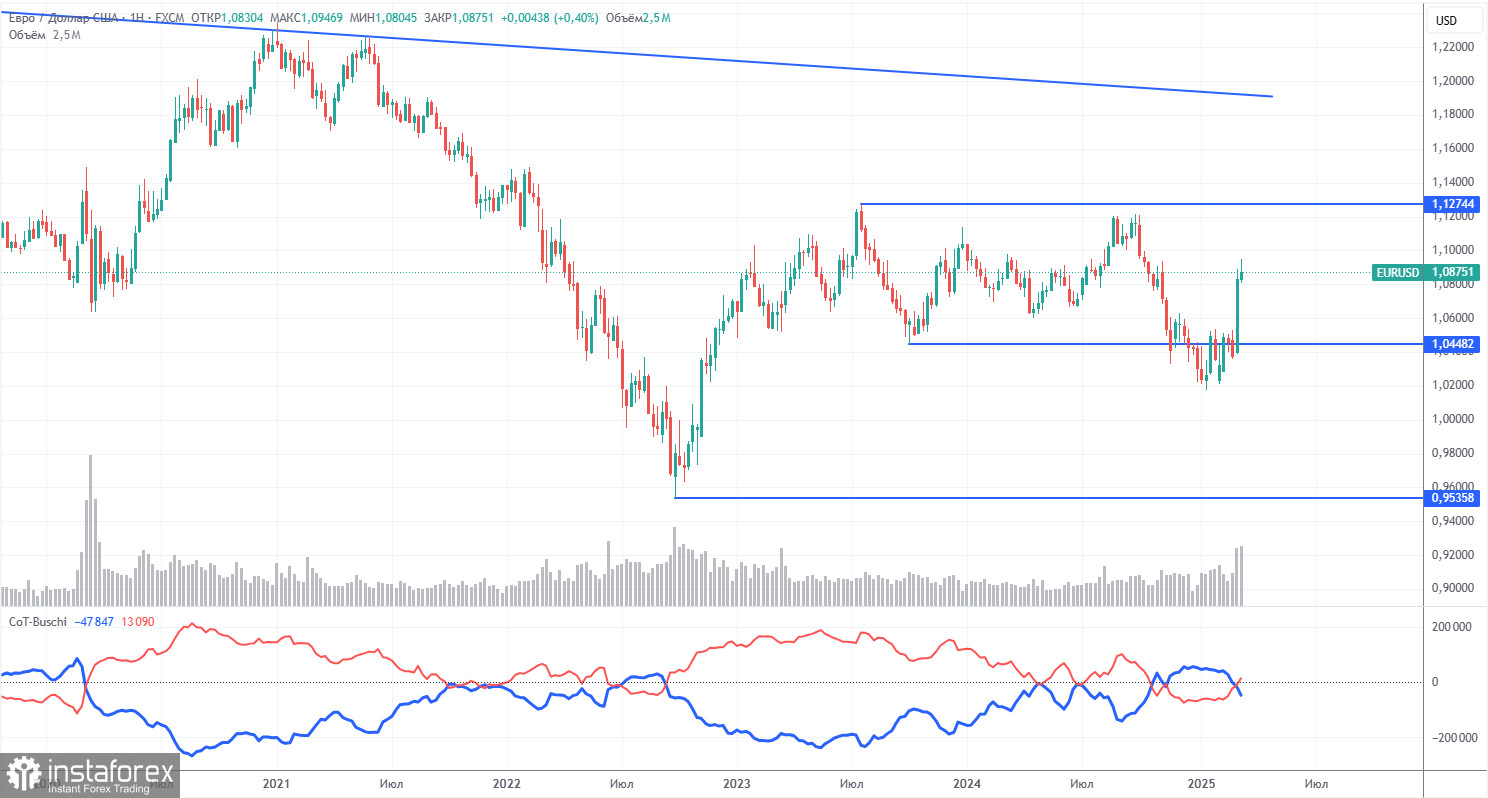
The latest COT report, dated March 11, indicates that the net position of non-commercial traders has remained "bullish" for an extended period. Bears have struggled to gain control, but bulls are now regaining the upper hand. The advantage that bears once had is diminishing as Trump takes office and the dollar continues to decline. While we cannot definitively predict that the dollar's decline will persist, COT reports reflect the sentiment of major market players, which can change rapidly under current circumstances.
Although there are still no fundamental factors to justify a strengthening of the euro, one significant factor is currently weighing on the dollar. The EUR/USD pair may continue to correct for several weeks or even months, but it is unlikely that the 16-year downward trend will be reversed quickly.
At present, the red and blue lines have crossed again, indicating a "bullish" market trend. Over the last reporting week, long positions among non-commercial traders increased by 3,400, while short positions decreased by 19,800. As a result, the net position rose by another 23,200 contracts.
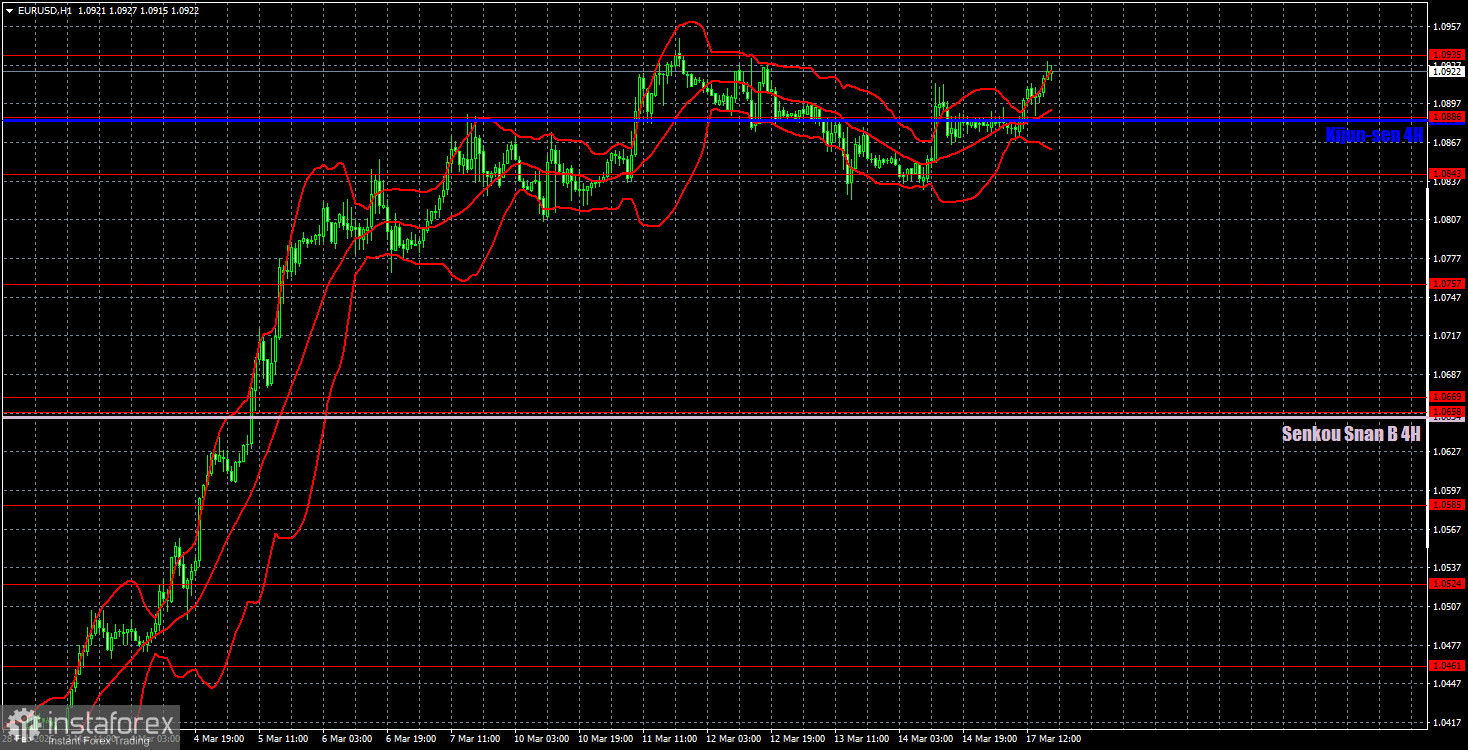
The price continues to move upward on the hourly timeframe, though not as rapidly as before. A decline will likely resume in the medium term due to the monetary policy divergence between the ECB and the Fed. However, it is uncertain how long the market will continue reacting exclusively to the "Trump factor." The current upward movement is merely panic in the market, and its ultimate direction remains unclear. Traders ignore everything except Trump's statements; the dollar is sold off at every opportunity. All positive news for the dollar is being disregarded.
For March 18, we highlight the following key levels for trading: 1.0340-1.0366, 1.0461, 1.0524, 1.0585, 1.0658-1.0669, 1.0757, 1.0797, 1.0843, 1.0886, 1.0935, 1.1006, 1.1092, as well as the Senkou Span B (1.0654) and Kijun-sen (1.0884) lines. The Ichimoku indicator lines may shift throughout the day, so this should be considered when identifying trade signals. Don't forget to set a Stop Loss at breakeven if the price moves 15 pips in the right direction, which helps protect against potential losses in case of a false signal.
On Tuesday, the Eurozone is set to release the ZEW economic sentiment indices, which are expected to be interesting but may not capture much market attention. In the U.S., there are also notable reports coming out, including housing starts and building permits. However, this data is unlikely to significantly influence market sentiment or provoke strong reactions. The only report that may have some relevance is on industrial production.
InstaForex analytical reviews will make you fully aware of market trends! Being an InstaForex client, you are provided with a large number of free services for efficient trading.


