 Stay
Stay 
Trading Conditions
Products
Tools


The EUR/USD currency pair traded on Tuesday in the same manner as on Monday. Yesterday, we warned that despite the large number of macroeconomic events, they might not influence the market sentiment or the pair's movement. The reports were important but didn't ignite any greater desire among market participants to trade more actively. Of course, we should highlight the eurozone inflation report, which slowed to 2.2% YoY in March—below economists' forecasts. Core inflation also slowed to 2.4%. As we can see, both indicators are already near the European Central Bank's target level. The ECB may take occasional pauses in easing simply because it has already cut rates six times, and the process needs to slow down. However, the ECB still has no reason to stop easing monetary policy.
We should also mention the U.S. ISM Manufacturing PMI, which fell to 49 in March—worse than expected. Thus, even if the dollar wanted to appreciate slightly ahead of Trump's new tariffs, it didn't have much chance. The dollar has been gaining somewhat in recent weeks, but the movement is so weak that it feels like the market is either waiting for something significant—or simply resting. And such a rest could last for months.
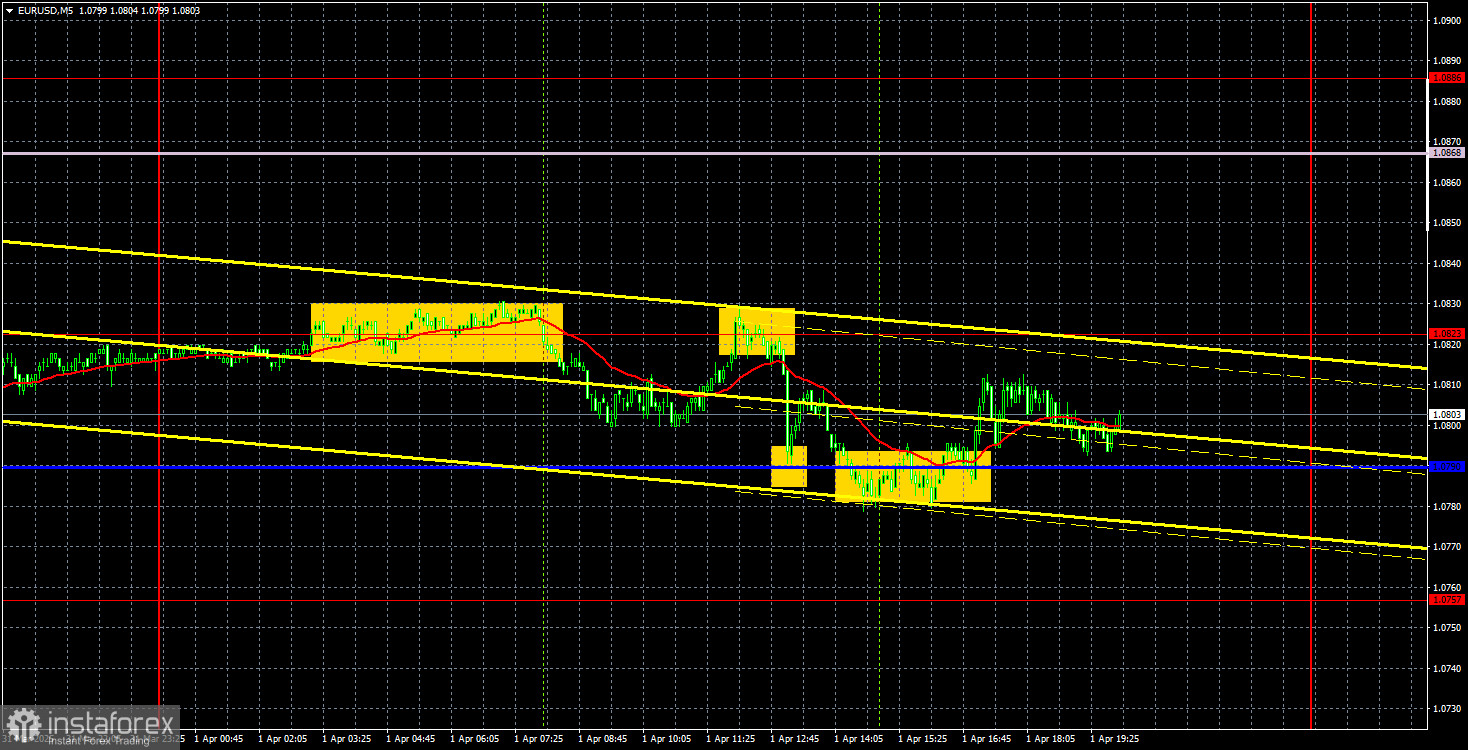
On the 5-minute timeframe on Tuesday, several trading signals were formed, but there was little point in acting on them. All signals emerged between the level of 1.0823 and the Kijun-sen line, which lay around 1.0790—just a 33-pip range. Volatility was very low. Was there any value in opening positions with a Take Profit set at approximately 15-20 pips?
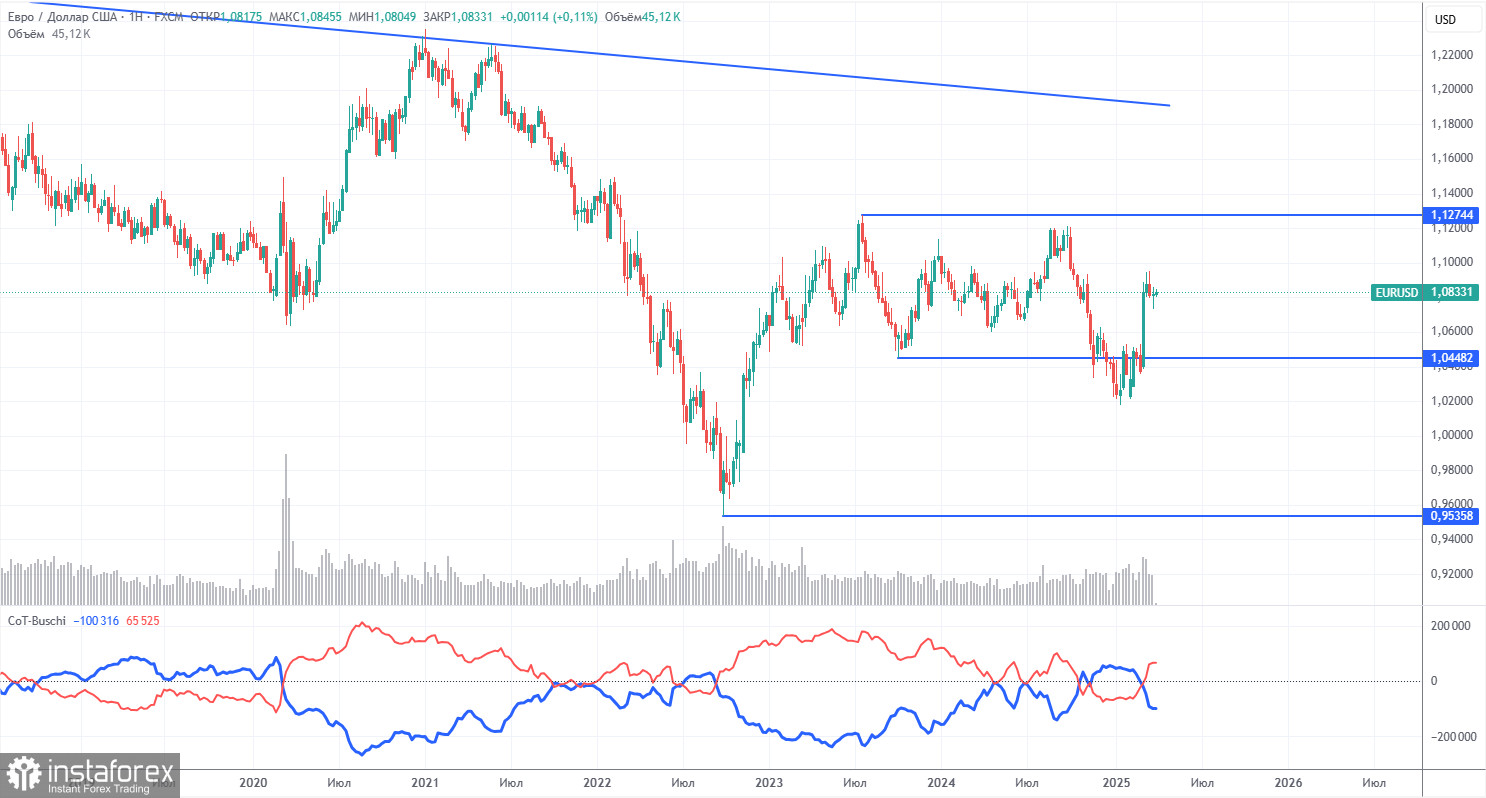
The latest COT report is dated March 25. The illustration above clearly shows that the net position of non-commercial traders had remained bullish for a long time. Bears struggled to gain dominance, but now the bulls have retaken the initiative. The bears' advantage has faded since Trump became President, and the dollar started plummeting. We cannot say with certainty that the decline of the U.S. currency will continue, as COT reports reflect the sentiment of large players—which, under current circumstances, can change rapidly.
We still see no fundamental factors supporting the strengthening of the euro, but one very significant factor has emerged for the weakening of the dollar. The pair may continue to correct for several more weeks or months, but a 16-year downward trend will not be reversed so quickly.
The red and blue lines have crossed again, indicating that the market trend is now "bullish." During the last reporting week, the number of long positions in the "Non-commercial" group increased by 800, while the number of short positions decreased by 5,200. Accordingly, the net position increased by another 44,400 thousand contracts.
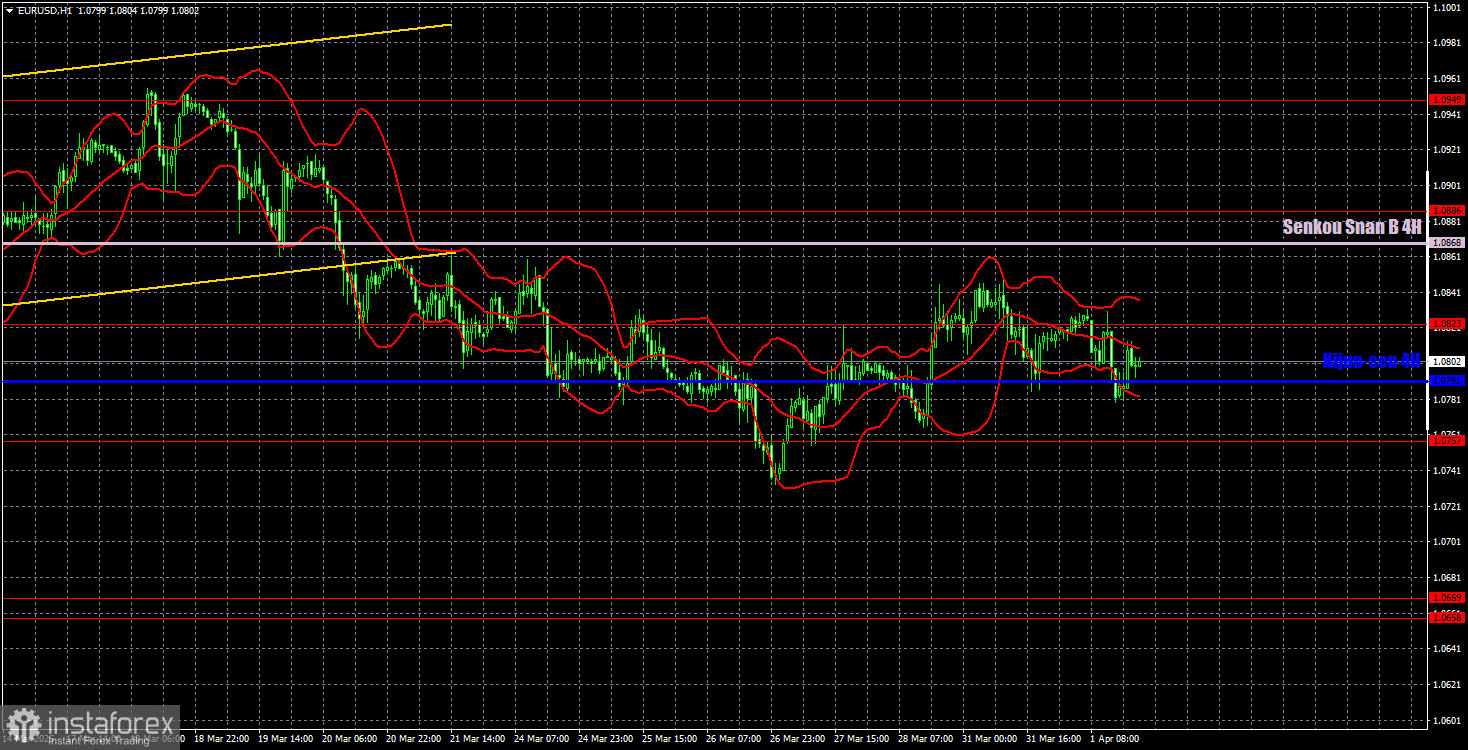
On the hourly chart, the downward movement of the EUR/USD pair ended very quickly once Trump began introducing new tariffs. Due to the monetary policy divergence between the ECB and the Fed, the decline will likely resume in the medium term. However, it's unclear how long the market will keep pricing in the "Trump factor." It's also unknown how much time the market needs to return to previous levels of volatility. Traders are ignoring many news items and data releases, and the dollar is being sold off at every opportunity—yet it still can't manage to rise even when it has the reasons to do so.
For April 2, we highlight the following levels for trading: 1.0340–1.0366, 1.0461, 1.0524, 1.0585, 1.0658–1.0669, 1.0757, 1.0797, 1.0823, 1.0886, 1.0949, 1.1006, 1.1092, as well as the Senkou Span B (1.0868) and Kijun-sen (1.0791) lines. Remember that the Ichimoku indicator lines can move during the day, which should be considered when identifying trading signals. Don't forget to set a Stop Loss to break even if the price moves 15 pips in the correct direction. This will help protect against potential losses if the signal is false.
On Wednesday, the only potentially notable event is the ADP report on changes in nonfarm employment. This is considered an analog of the Nonfarm Payrolls report, though it's much less significant and has no consistent correlation with its "big brother." Therefore, the market may react to this release, but a strong reaction is unlikely.
InstaForex analytical reviews will make you fully aware of market trends! Being an InstaForex client, you are provided with a large number of free services for efficient trading.


