 Stay
Stay 
Trading Conditions
Products
Tools


The EUR/USD currency pair showed strong upward movement on Thursday. Frankly, we've been saying the same thing for the past two months: whenever the pair shows significant growth, it's only due to Donald Trump introducing new import tariffs in the U.S. This reason is so simple and evident that it requires no additional explanation. It's straightforward: Trump announces new tariffs – and the dollar immediately crashes.
At the beginning of this week, we believed the market had already "had enough" of Trump's trade-related grievances with the rest of the world, so we didn't expect a strong reaction to the "April 2 tariffs." Since last week, the market has essentially ignored the "automobile tariffs." However, Trump introduced far broader sanctions than even the most extreme pessimists had anticipated. The dollar plunged once again.
All other macroeconomic events were and still are irrelevant. On Thursday, the U.S. released the ISM Services PMI, which dropped from 53.5 to 50.8. That became yet another excuse to sell the dollar—but ironically, during the U.S. trading session, the dollar stopped depreciating and began to recover. Today, the U.S. will release critical reports on employment and unemployment, and Federal Reserve Chair Jerome Powell is scheduled to speak—likely commenting on the new trade reality. But what influence can these events have if the dollar's movements are driven purely by "Trump factors"? Suppose the dollar rises on Friday—next week, Trump may announce an expansion of his tariff policy, and the dollar will plunge again.
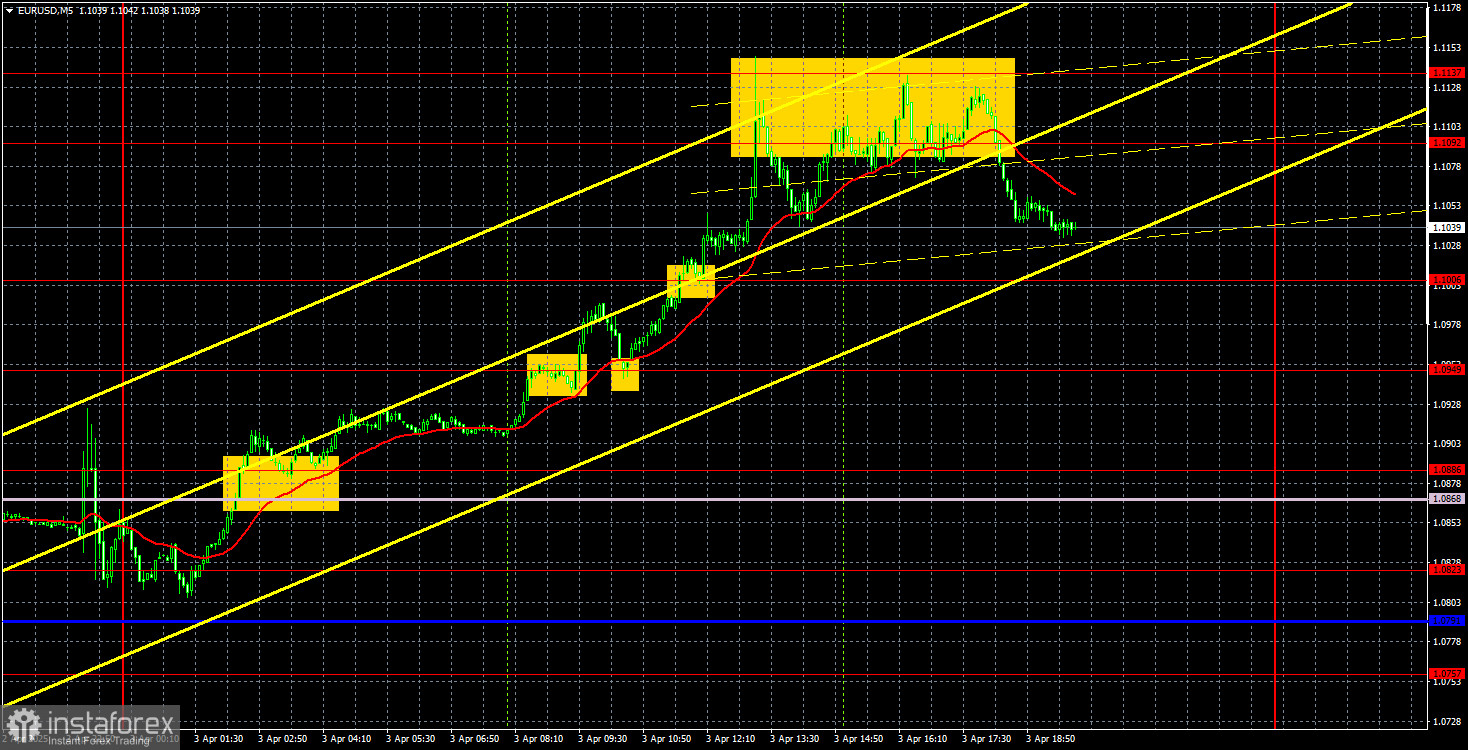
We don't see much point in analyzing Thursday's trading signals, even though they could have yielded excellent profits. The movements were too intense—abnormally strong and sharp. We believe such volatility is too dangerous to trade on.
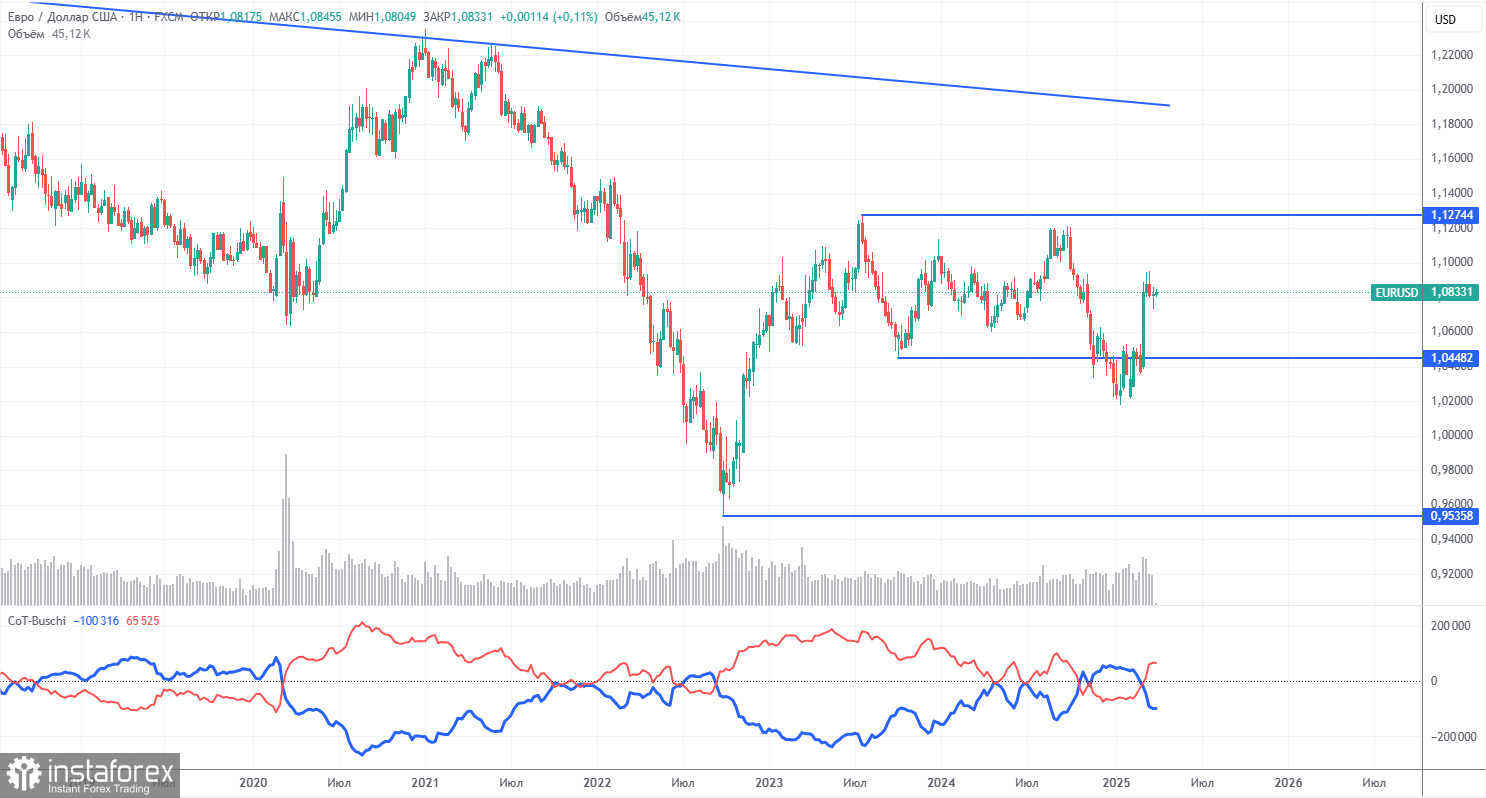
The latest COT report is dated March 25. The illustration above clearly shows that the net position of non-commercial traders had remained bullish for a long time. Bears struggled to gain dominance, but now the bulls have retaken the initiative. The bears' advantage has faded since Trump became President, and the dollar started plummeting. We cannot say with certainty that the decline of the U.S. currency will continue, as COT reports reflect the sentiment of large players—which, under current circumstances, can change rapidly.
We still see no fundamental factors supporting the strengthening of the euro, but one very significant factor has emerged for the weakening of the dollar. The pair may continue to correct for several more weeks or months, but a 16-year downward trend will not be reversed so quickly.
The red and blue lines have crossed again, indicating that the market trend is now "bullish." During the last reporting week, the number of long positions in the "Non-commercial" group increased by 800, while the number of short positions decreased by 5,200. Accordingly, the net position increased by another 44,400 thousand contracts.
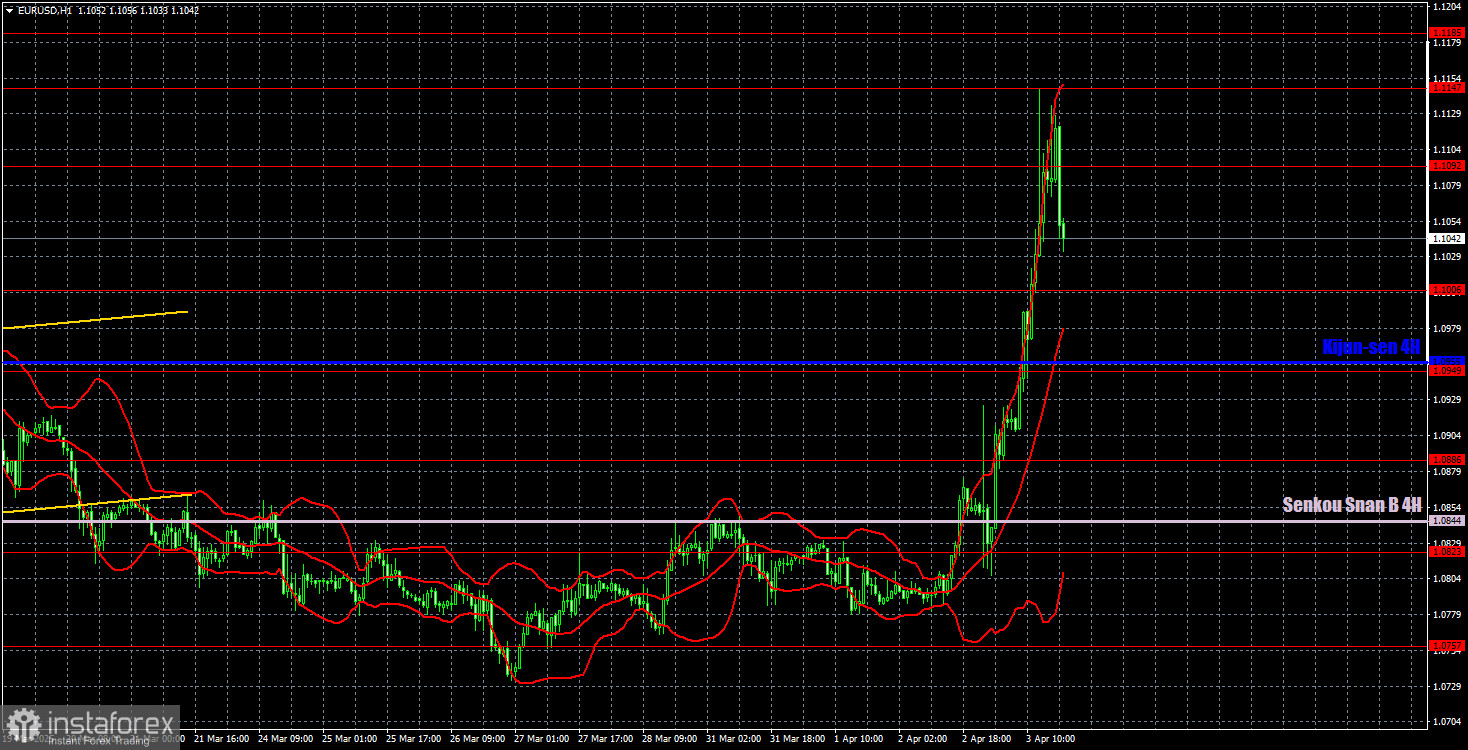
The EUR/USD pair quickly ended its downward correction on the hourly timeframe when Trump started imposing new tariffs. The downtrend will likely resume in the medium term due to the divergence in ECB and Fed monetary policies. However, no one knows how long the market will continue reacting only to "Trump factors." Traders ignore many news reports and economic releases; the dollar is sold off at every opportunity and can't rally even when the data supports it. No one knows what tariffs Trump will announce next or when, making even a two-week forecast practically meaningless.
For April 4, we highlight the following trading levels: 1.0461, 1.0524, 1.0585, 1.0658–1.0669, 1.0757, 1.0797, 1.0823, 1.0886, 1.0949, 1.1006, 1.1092, 1.1147, 1.1185, 1.1234, as well as the Senkou Span B line (1.0844) and the Kijun-sen line (1.0955). Note that the Ichimoku indicator lines may shift throughout the day, so this should be considered when identifying trading signals. Don't forget to place a Stop Loss at breakeven if the price moves 15 pips in your favor—this will protect against potential losses from false signals.
No significant events are scheduled in the Eurozone on Friday, but the U.S. will continue to surprise traders with high-impact events. In addition to the NonFarm Payrolls and unemployment reports, Powell's speech is also expected. It looks like more "fireworks" are coming today.
InstaForex analytical reviews will make you fully aware of market trends! Being an InstaForex client, you are provided with a large number of free services for efficient trading.
Your IP address shows that you are currently located in the USA. If you are a resident of the United States, you are prohibited from using the services of Instant Trading EU Ltd including online trading, online transfers, deposit/withdrawal of funds, etc.
If you think you are seeing this message by mistake and your location is not the US, kindly proceed to the website. Otherwise, you must leave the website in order to comply with government restrictions.
Why does your IP address show your location as the USA?
Please confirm whether you are a US resident or not by clicking the relevant button below. If you choose the wrong option, being a US resident, you will not be able to open an account with InstaForex anyway.
We are sorry for any inconvenience caused by this message.


