Trading Conditions
Products
Tools

Daily Outlook
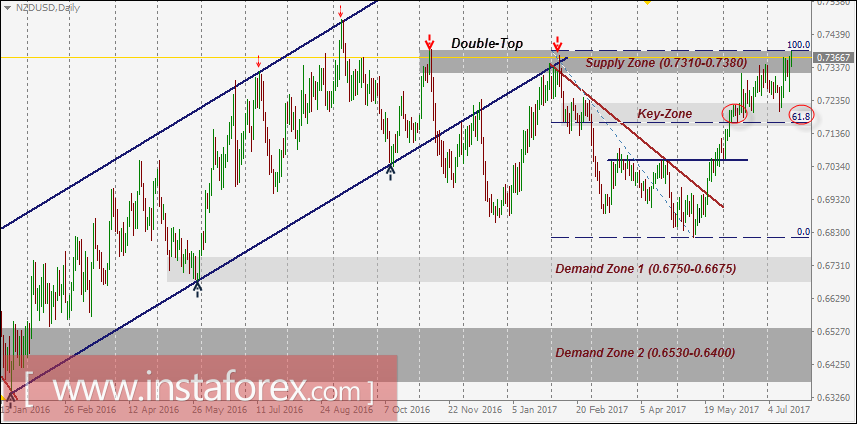
The NZD/USD pair has been trending up within the depicted bullish channel since January 2016.
In November 2016, early signs of bullish weakness were expressed on the chart when the pair failed to record a new high above 0.7400.
A bearish breakout of the lower limit of the channel took place in December 2016.
In February 2017, the depicted short-term downtrend was initiated in the depicted supply zone (0.7310-0.7380).
However, a recent bullish breakout above the downtrend line took place in May 22. Since then, the market has been bullish as depicted on the chart.
The price zone of 0.7150-0.7230 (SUPPLY ZONE in confluence with 61.8% Fibonacci level) stood as a temporary resistance zone until a bullish breakout was expressed above 0.7230.
This resulted in a quick bullish advance towards the next supply zone around 0.7310-0.7380 where evident bearish rejection and a valid SELL opportunity can be offered if enough bearish rejection is expressed.
Currently, the NZD/USD pair remains trapped between the price levels of 0.7230 - 0.7310 until a breakout occurs in either direction.
Trade recommendations:
Risky traders can have a valid SELL entry at retesting of the price zone of 0.7310-0.7400. S/L should be placed above 0.7440.
Conservative traders can wait for a bearish closure below 0.7230 then 0.7150 (61.8% Fibo level) for a valid SELL position.
S/L should be placed above 0.7250 while T/P levels should be placed at 0.7050, 0.6970, and 0.6850.
InstaForex analytical reviews will make you fully aware of market trends! Being an InstaForex client, you are provided with a large number of free services for efficient trading.
We may place cookies for analysis of our visitor data, to improve our website and measure advertising performance. Overall this data is used to provide a better website experience. More information
Your IP address shows that you are currently located in the USA. If you are a resident of the United States, you are prohibited from using the services of Instant Trading EU Ltd including online trading, online transfers, deposit/withdrawal of funds, etc.
If you think you are seeing this message by mistake and your location is not the US, kindly proceed to the website. Otherwise, you must leave the website in order to comply with government restrictions.
Why does your IP address show your location as the USA?
Please confirm whether you are a US resident or not by clicking the relevant button below. If you choose the wrong option, being a US resident, you will not be able to open an account with InstaForex anyway.
We are sorry for any inconvenience caused by this message.
 Stay
Stay 


