
 Stay
Stay 


Patterns are graphical models which are formed in the chart by the price. According to one of the technical analysis postulates, history (price movement) repeats itself. It means that the price movements are often similar in the same situations which makes it possible to predict the further development of the situation with a high probability.
Discover Forex chart patterns, signals, and trading strategies on InstaForex.
was formed on 18.03 at 16:39:45 (UTC+0)
signal strength 1 of 5
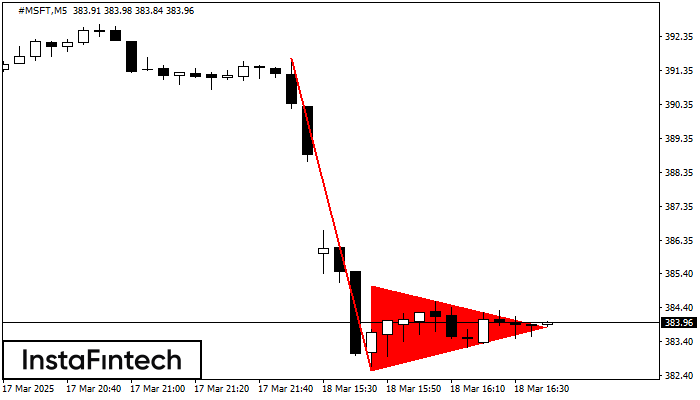
The Bearish pennant pattern has formed on the #MSFT M5 chart. It signals potential continuation of the existing trend. Specifications: the pattern’s bottom has the coordinate of 382.56; the projection of the flagpole height is equal to 913 pips. In case the price breaks out the pattern’s bottom of 382.56, the downtrend is expected to continue for further level 382.41.
The M5 and M15 time frames may have more false entry points.


