
 Stay
Stay 


Patterns are graphical models which are formed in the chart by the price. According to one of the technical analysis postulates, history (price movement) repeats itself. It means that the price movements are often similar in the same situations which makes it possible to predict the further development of the situation with a high probability.
Relevant patterns by InstaForex is an easy-to-use service which allows you to be aware of latest changes in the market and react to clues from the market in time. In our service you will always find the latest and most relevant patterns on any pair and any timeframe.
was formed on 28.03 at 20:16:00 (UTC+0)
signal strength 1 of 5
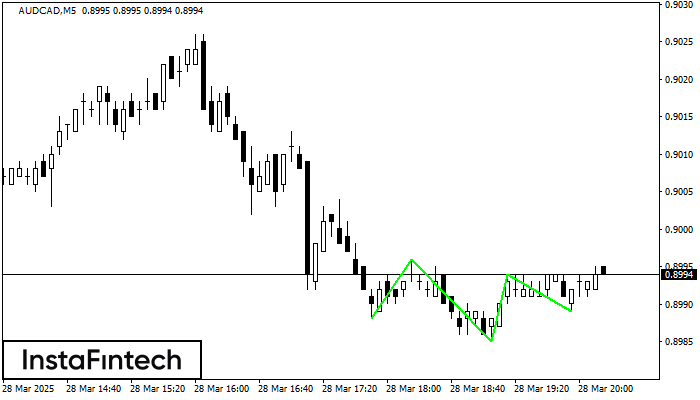
According to the chart of M5, AUDCAD produced the pattern termed the Inverse Head and Shoulder. The Head is fixed at 0.8985 while the median line of the Neck is set at 0.8996/0.8994. The formation of the Inverse Head and Shoulder Pattern clearly indicates a reversal of the downward trend. In means that in case the scenario comes true, the price of AUDCAD will go towards 0.9009.
The M5 and M15 time frames may have more false entry points.
See Also
- All
- Double Top
- Flag
- Head and Shoulders
- Pennant
- Rectangle
- Triangle
- Triple top
- All
- #AAPL
- #AMZN
- #EBAY
- #FB
- #GOOG
- #INTC
- #KO
- #MA
- #MCD
- #MSFT
- #NTDOY
- #PEP
- #TSLA
- #TWTR
- AUDCAD
- AUDCHF
- AUDJPY
- AUDUSD
- EURCAD
- EURCHF
- EURGBP
- EURJPY
- EURNZD
- EURRUB
- EURUSD
- GBPAUD
- GBPCHF
- GBPJPY
- GBPUSD
- GOLD
- NZDCAD
- NZDCHF
- NZDJPY
- NZDUSD
- SILVER
- USDCAD
- USDCHF
- USDJPY
- USDRUB
- All
- M5
- M15
- M30
- H1
- D1
- All
- Buy
- Sale
- All
- 1
- 2
- 3
- 4
- 5

Il modello grafico Gagliardetto Rialzista si è formato sullo strumento NZDCAD M30. Questo tipo di modello rientra nella categoria dei modelli di continuazione. In questo caso, se la quotazione
Open chart in a new window
Secondo il grafico di M5, #Bitcoin ha formato il Rettangolo Rialzista che è un modello di una continuazione di trend. Il modello è contenuto entro i seguenti confini: il confine
I time frame M5 e M15 possono avere più punti di ingresso falsi.
Open chart in a new window
Il modello Doppio Minimo è stato formato su USDJPY M5. Questa formazione segnala un'inversione del trend dal discendente all'ascendente. Il segnale è che una posizione buy dovrebbe essere aperta dopo
I time frame M5 e M15 possono avere più punti di ingresso falsi.
Open chart in a new window


