 Maradok
Kereskedési feltételek
Products
Eszkozok


GBP/USD 5M
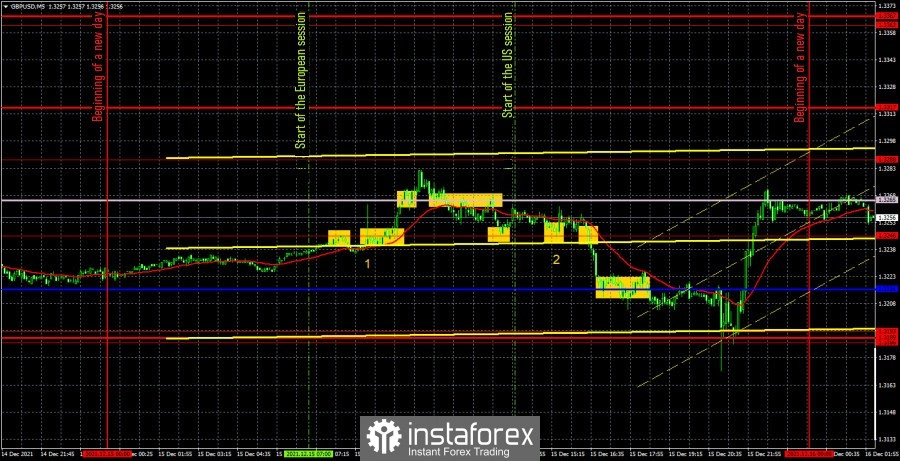
The GBP/USD pair showed volatility equal to 80 points on Wednesday. This is with regard to the movement before summing up the results of the Federal Reserve meeting in the evening. Thus, the British pound did not stand still during the day, but at the same time continued to trade inside the horizontal channel, which is clearly seen in the chart below. We have slightly adjusted the levels and now it is clearly visible that last week's trading takes place between 1.3186 and 1.3276. That is, in the 90-point range. However, on the 5-minute TF, the movements looked more solid and enough trading signals were formed. Before we begin to analyze them, we note that the US retail sales report had no effect on the pair's movement (the figure "2" in the chart above), and the report on British inflation, which exceeded forecasts and amounted to 5.1% y/y in November, caused only a 20-point upward movement, which was quickly offset. Strangely, inflation should have supported the pound much more. But, however, after the release of the report, the pound still rose in price for several hours. Now as for trading signals. The first two signals should have been ignored. The first was formed just half an hour before the release of the report on British inflation, and the second half an hour after. Formally, the second signal could be worked out, since it was for long positions (overcoming the level of 1.3246), and the nature of the report itself implied the pair's growth, but when the signal was formed, the price already rested on the Senkou Span line B. Then another buy signal was formed, but at the time of its formation, the price stayed on the next level - the extremum of 1.3288, so this signal should have been ignored. Then there was a sell signal when the price dropped below Senkou Span B and since the consolidation was not too deep, it was possible to open short positions here, but later the price bounced several times from the level of 1.3246, so this short position did not bring profit. As well as buy signals about a rebound from the level of 1.3246. As a result, the pair settled below 1.3246 and here traders could open short positions, and the last long position closed at a loss of 13 points. According to the short position, it was possible to earn about 20 points when the pair worked out the Kijun-sen line and could not confidently overcome it. Thus, the day ended in minimal profit.
GBP/USD 1H
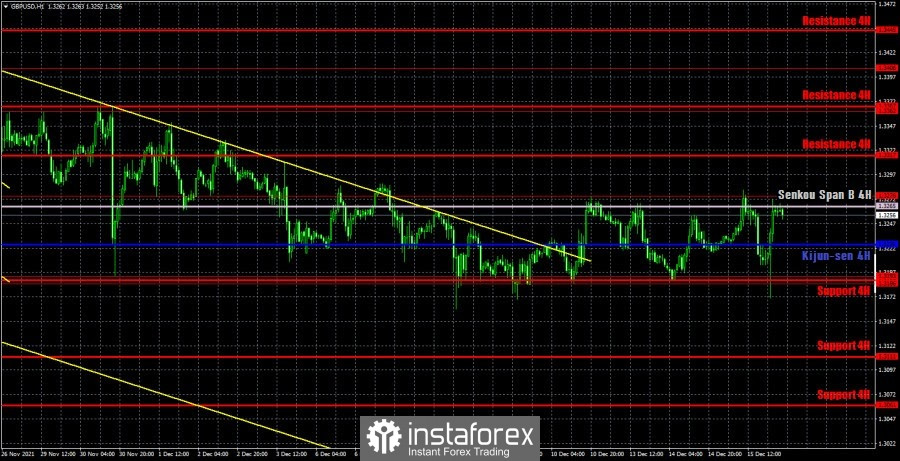
On the hourly timeframe, the pound/dollar pair, after leaving the descending channel, tries to start an upward trend with all its might, but the bulls could not settle above the Senkou Span B line. Movements from last night and this afternoon can take the pair in any direction and far enough. Or they can simply turn into high volatility and return to their original positions. Therefore, we are not taking them into account yet and are waiting for the markets to calm down after two meetings of central banks. We highlight the following important levels on December 16: 1.3186-1.3193, 1.3276, 1.3362, 1.3406. There are no levels below, as the price has not been so low for more than a year. The Senkou Span B (1.3265) and Kijun-sen (1.3226) lines can also be signal sources. Signals can be "rebounds" and "breakthroughs" of these levels and lines. It is recommended to set the Stop Loss level to breakeven when the price passes in the right direction by 20 points. The lines of the Ichimoku indicator can move during the day, which should be taken into account when searching for trading signals. The results of the Bank of England meeting will be summed up in the UK on Thursday. This is the key event of the day, but in addition to it, business activity indices in the services and manufacturing sectors in the UK will be published, as well as a whole package of macroeconomic statistics in America. All these reports can also affect the pair's movement during the day, although, of course, not as much as the meetings of central banks.
We recommend you to familiarize yourself:
Overview of the EUR/USD pair. December 16. The Fed did not surprise the markets, but it continues to follow the path of tightening.
Overview of the GBP/USD pair. December 16. Boris Johnson's rating continues to fall into the abyss.
Forecast and trading signals for EUR/USD for December 16. Detailed analysis of the movement of the pair and trade deals.
COT report
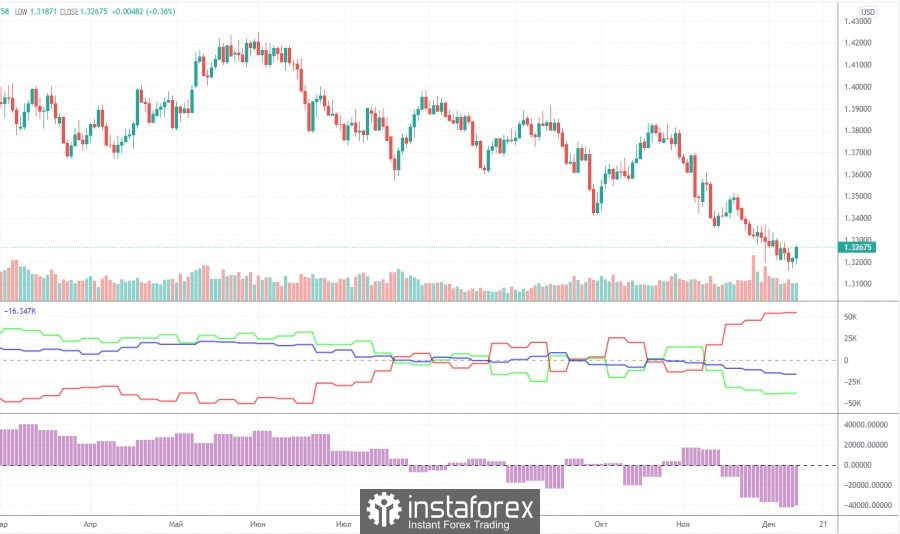
The mood of professional traders became a little less bearish during the last reporting week (November 30 – December 6). Professional traders closed 3,600 sell contracts (shorts) and 2,100 buy contracts (longs) during the week. Thus, the net position for the "non-commercial" group of traders increased by 1,500 contracts. This is a very small change even for the British pound. In general, the mood of non-commercial traders continues to be bearish, and quite strong. We draw your attention to how low the green line of the first indicator is located in the chart above, which reflects the net position of the non-commercial group. Thus, unlike the euro, the pound's decline in recent weeks looks just logical: major players sell off the currency, and it falls. A further decline in the British currency is also now quite likely, but at the same time we draw your attention to the fact that the green and red lines of the first indicator have moved quite far from each other. This may indicate that the downward trend is drying up. Thus, we get a situation in which the euro currency is not moving down quite logically, and the pound may complete its movement in the near future. Thus, for both major pairs, we recommend waiting for the downward trend to end, but do not start buying until specific buy signals are formed.
Explanations for the chart:
Support and Resistance Levels are the levels that serve as targets when buying or selling the pair. You can place Take Profit near these levels.
Kijun-sen and Senkou Span B lines are lines of the Ichimoku indicator transferred to the hourly timeframe from the 4-hour one.
Support and resistance areas are areas from which the price has repeatedly rebounded off.
Yellow lines are trend lines, trend channels and any other technical patterns.
Indicator 1 on the COT charts is the size of the net position of each category of traders.
Indicator 2 on the COT charts is the size of the net position for the non-commercial group.
InstaForex analytical reviews will make you fully aware of market trends! Being an InstaForex client, you are provided with a large number of free services for efficient trading.


