 Maradok
Kereskedési feltételek
Products
Eszkozok


Eurozone inflation estimates jumped again to a historical record. The growth rate of consumer prices accelerated in March from 5.9% to 7.5%. This is a negative factor for the European currency, which will once again become a topic for discussion on the tightening of the ECB's monetary policy.
The report of the U.S. Department of Labor was rightfully considered the main macroeconomic event, which did not come out badly. The unemployment rate in March decreased from 3.8% to 3.6%, with a forecast at 3.7%. New jobs outside the agriculture sector were 426,000, with expectations of 480,000. It is worth considering that the previous data was revised in favor of growth from 654,000 to 739,000.
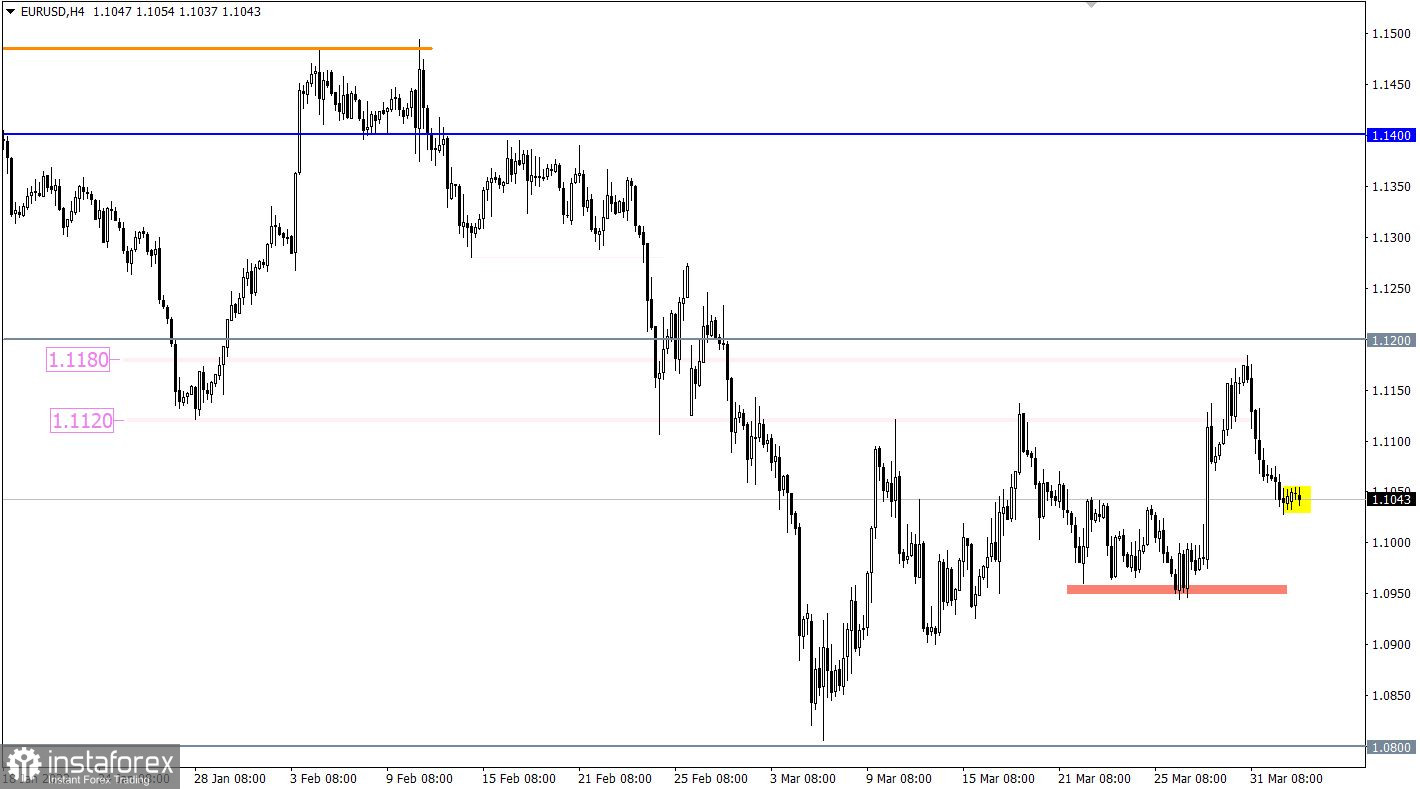
The EURUSD currency pair managed to partially restore dollar positions during the price rebound from the resistance range level of 1.1120/1.1180. This movement returned the quote to the psychologically important area of 1.1000, where there was a slight stagnation.
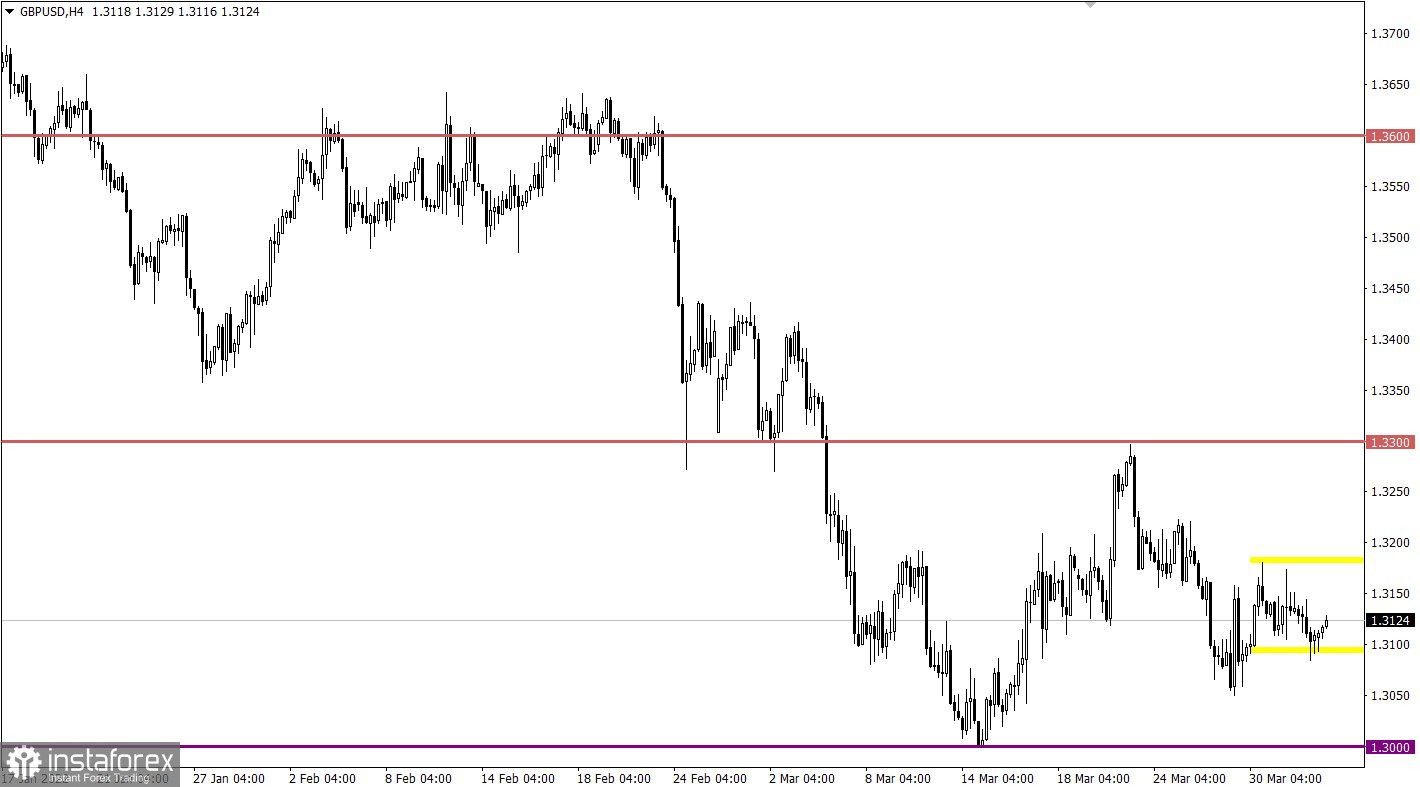
The GBPUSD currency pair continues to move in the range of 1.3105/1.3180, despite sellers' attempts to overcome its lower limit. Long-term movement of the price in a closed amplitude leads to the accumulation of trading forces, which can lead to acceleration in the market.

Monday is traditionally accompanied by an empty macroeconomic calendar. Nevertheless, stable information and news flow will continue to play on the nerves of speculators, which allows for new jumps in the market.
At the moment, the market remains stagnant, which can lead to the accumulation of trading forces and, as a result, new price jumps. A signal to prolong the downward cycle will appear on the market after the price is kept below the value of 1.1025. This step may lead to a decline towards 1.1000–1.0960.
An alternative scenario of the market development will be considered by traders in the event of a local pullback, which may temporarily return the quote to the value of 1.1120. This signal will be relevant if the price is kept above the value of 1.1080 in a four-hour period.
In this situation, traders are still considering trading tactics for breaking through one or another flat border. In this regard, buy positions will be relevant after holding the price above 1.3185 in a four-hour period, and sell positions would be relevant after holding the price below 1.3100 in a four-hour period.
A candlestick chart view is graphical rectangles of white and black light, with sticks on top and bottom. When analyzing each candle in detail, you will see its characteristics of a relative period: the opening price, closing price, and maximum and minimum prices.
Horizontal levels are price coordinates, relative to which a stop or a price reversal may occur. These levels are called support and resistance in the market.
Circles and rectangles are highlighted examples where the price of the story unfolded. This color selection indicates horizontal lines that may put pressure on the quote in the future.
The up/down arrows are the reference points of the possible price direction in the future.
InstaForex analytical reviews will make you fully aware of market trends! Being an InstaForex client, you are provided with a large number of free services for efficient trading.

