 Maradok
Kereskedési feltételek
Products
Eszkozok


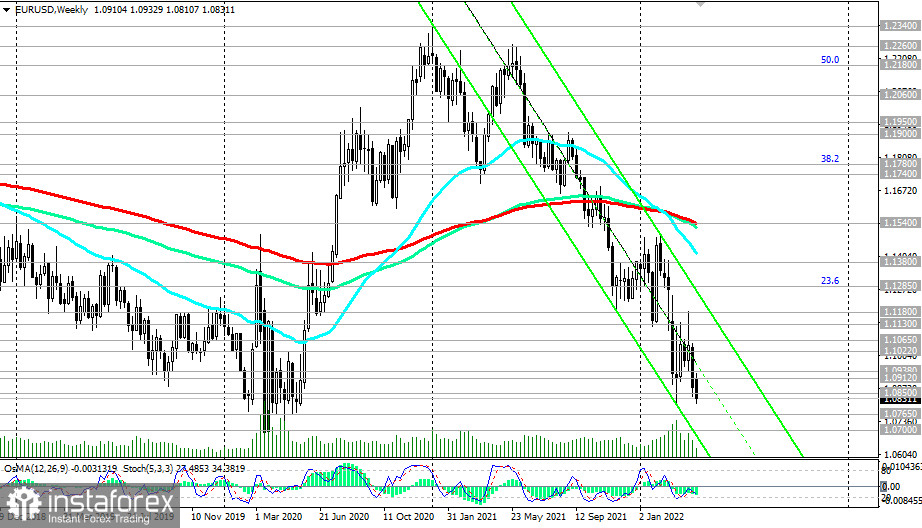
EUR/USD continues to decline against the background of strong fundamental factors. The pair is trading in the bear market zone, declining within the descending channels on the daily and weekly charts. The lower limit of the descending channel on the weekly chart is below 1.0700, near the lows of March 2020.
This mark may become a reference point for short positions on the pair with intermediate targets at 1.0800 and 1.0765.
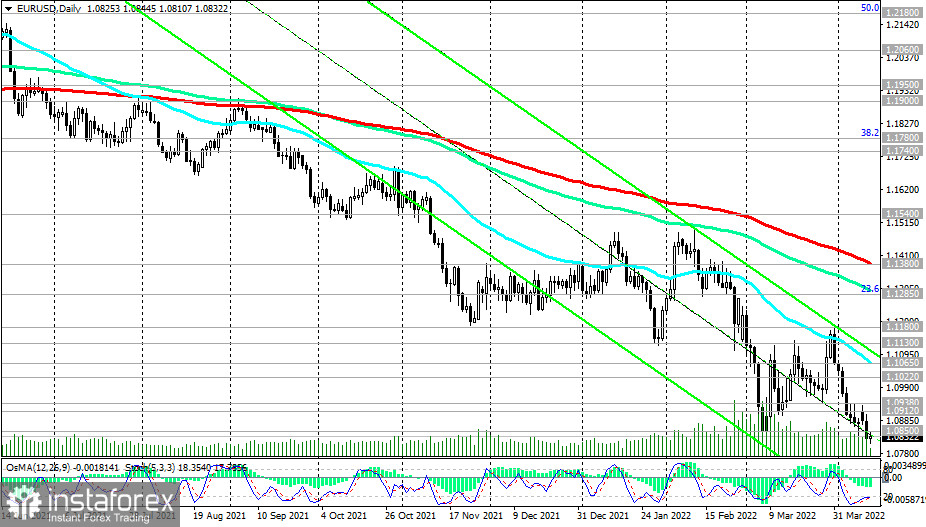
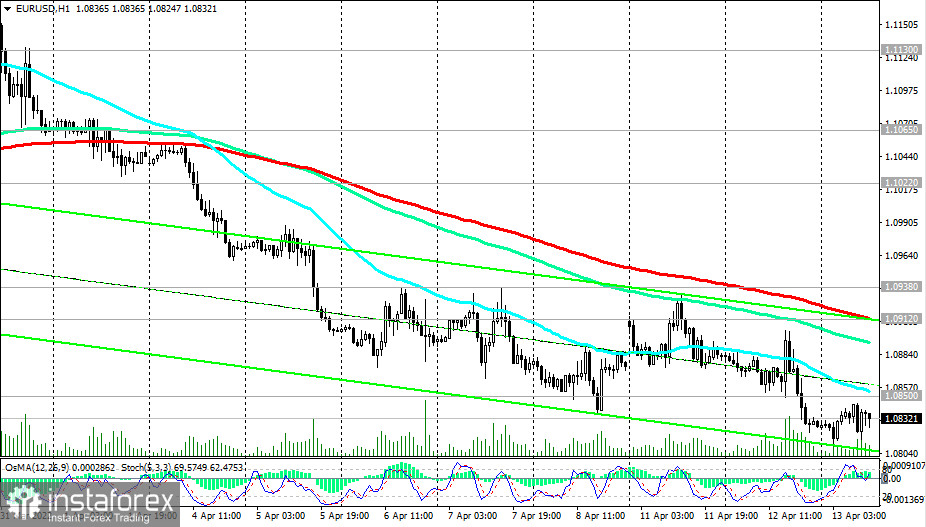
In the area below the resistance levels of 1.0912 (200 EMA on the 1-hour chart), 1.1022 (200 EMA on the 4-hour chart), 1.1065 (50 EMA and the upper line of the descending channel on the daily chart), nothing threatens EUR/USD short positions.
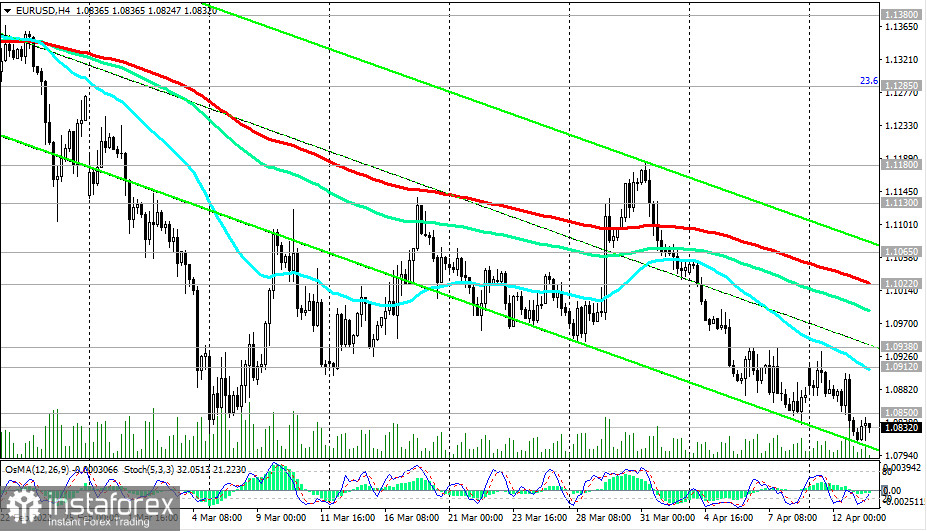
In an alternative scenario, corrective growth may begin after the breakdown of the resistance level of 1.0850 (200 EMA on the 15-minute chart and local low) with targets at the resistance levels of 1.0912, 1.0938, 1.1022, 1.1065, near which new pending sell orders can be placed.
Below resistance levels 1.1285 (144 EMA on the daily chart and 23.6% Fibonacci of the upward correction in the wave of the pair's decline from the level of 1.3870, which began in May 2014, to 1.0500), 1.1380 (200 EMA on the daily chart), EUR/USD is in the bear market zone. Downward dynamics prevails, making short positions preferable.
Support levels: 1.0800, 1.0765, 1.0700, 1.0500, 1.0350
Resistance levels: 1.0850 1.0912 1.0938 1.1000 1.1022 1.1065 1.1130 1.1180 1.1200 1.1285 1.1300 1.1380 1.1500 1.15 40 1.1740
Trading Tips
Sell Stop 1.0805. Stop-Loss 1.0870. Sell Limit 1.0912, 1.0938. Stop-Loss 1.0955. Sell Limit 1.1000, 1.1022, 1.1065. Stop-Loss 1.1085.
Buy Stop 1.0870. Stop-Loss 1.0805. Take-Profit 1.0912, 1.0938, 1.1000, 1.1022, 1.1065, 1.1130, 1.1180, 1.1200, 1.1285, 1.1300, 1.1380
InstaForex analytical reviews will make you fully aware of market trends! Being an InstaForex client, you are provided with a large number of free services for efficient trading.

