 Maradok
Kereskedési feltételek
Products
Eszkozok


Analysis of EUR/USD, 5-minute chart
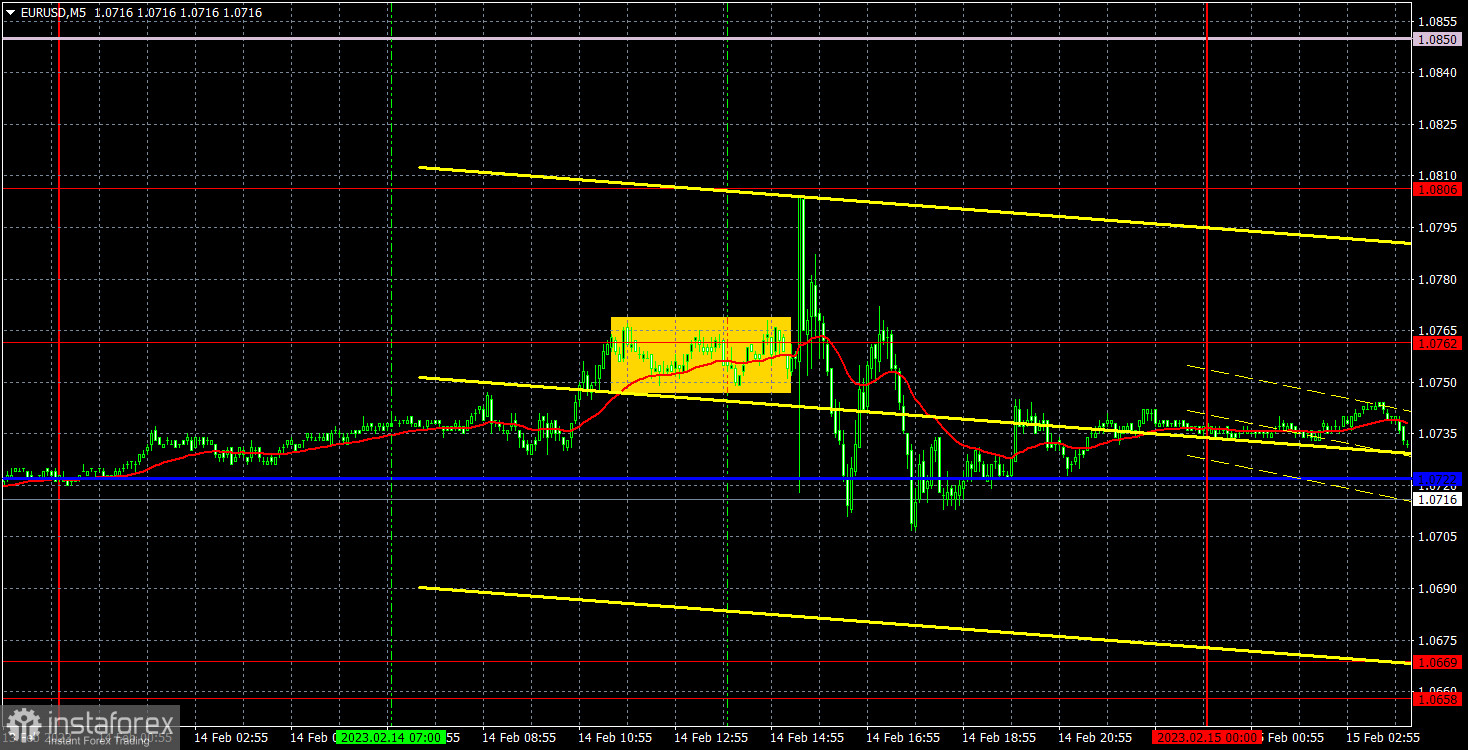
On Tuesday, the euro/dollar pair tried to continue its correctional movement. In the first part of the day, the pair showed a sluggish increase amid quite a good but still weak report on the eurozone GDP for the fourth quarter. Notably, the real data was in line with the forecast. At the beginning of the US trade, traders learnt the US inflation data, which led to a slump in the greenback. The initial market reaction was illogical. The fact is that in January, inflation slackened at the slowest pace. This means that the Fed may continue its monetary policy tightening. The inflation slackening has become slower. That is why the number of key rate hikes could increase. Against the backdrop, the US dollar should have increased but it did this with a delay. We still suppose that the euro/dollar pair will continue falling. It is wise to analyze only those trading signals that were formed before the publication of the inflation data. However, there were none of them. The pair reached 1.0762 but it neither bounced nor broke it. After the publication, the pair was moving in both directions. That is why it was too risky to trade.
COT report
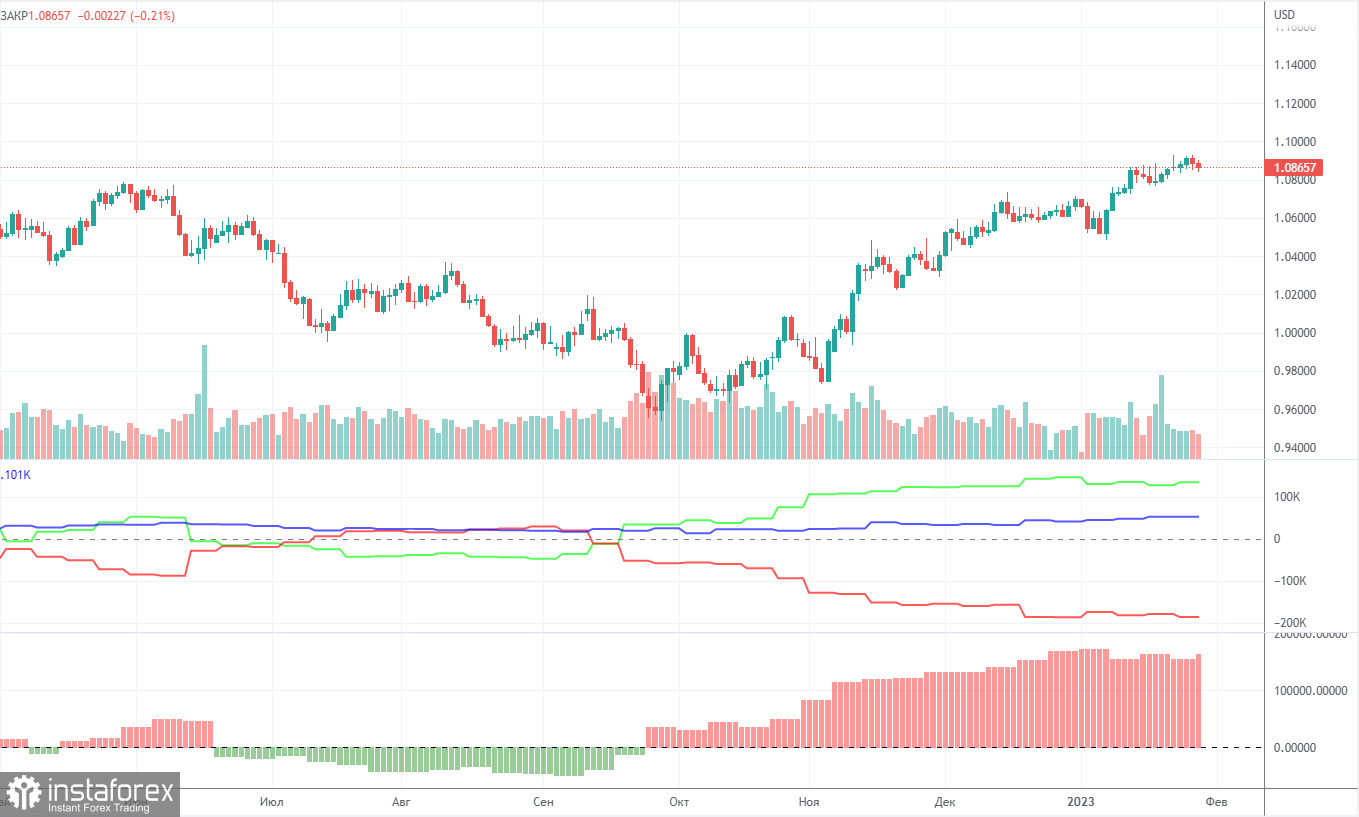
During recent months, the COT report on the euro fully corresponded to the market situation. On the chart, we see that the net position of big traders (second indicator) has been rising since September. The euro also started to increase at that time. At the moment, the net position of non-commercial traders is bullish and it is becoming stronger. It means that the uptrend may end soon. This is confirmed by the first indicator. The green and red lines are far from each other, which often signals the end of a trend. During the last reported week, the number of buy non-commercial positions increased by 9.5 thousand, whereas the number of short non-commercial positions advanced by 2 thousand. As a result, the net position jumped by 7.5 thousand. Now, the number of buy orders exceeds the number of sell ones by 134 thousand. In the last two weeks, there were no new COT reports. That is why we have to rely on the data we have. Nevertheless, the pair is likely to go on falling since correction should have started long ago.
Analysis of EUR/USD, 1-hour chart
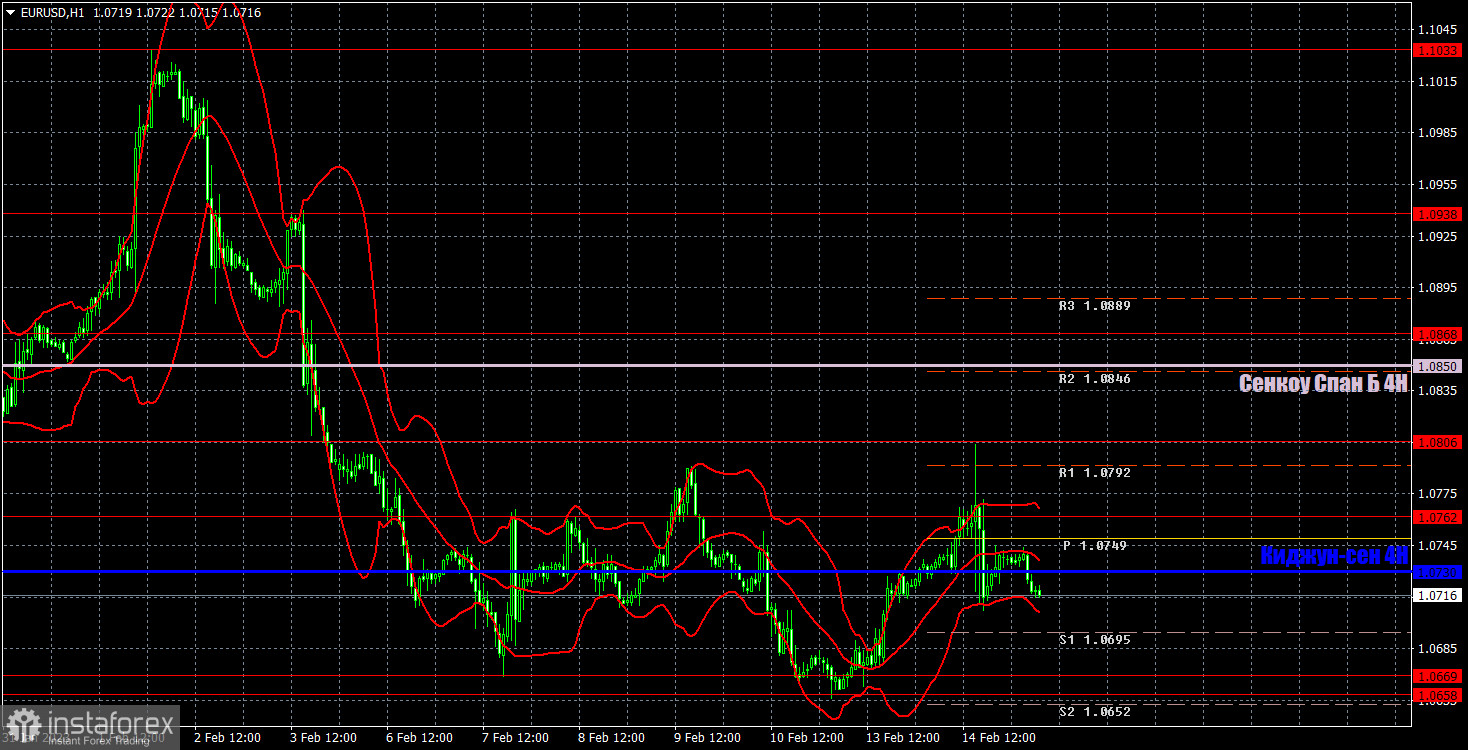
On the daily chart, the pair continues falling. It may slide below the critical line. Yesterday, it failed to reach the Senkou Span B line. Therefore, we continue to expect a further decline in the euro. The first target is the last local low near the level of 1.0658. On Wednesday, there are the following levels to focus on — 1.0485, 1.0581, 1.0658-1.0669, 1.0762, 1.0806, 1.0868, 1.0938, as well as the Senkou Span B (1.0850) and Kijun-sen (1.0730) lines. The lines of the Ichimoku indicator can move during the day, which should be taken into account when determining trading signals. There are also support and resistance levels, but trading signals are not formed near them. Breakouts and rebounds from these levels could be used as signals. Do not forget to place a stop-loss order at breakeven if the price goes in the right direction by 15 pips. This will protect against possible losses if the signal turns out to be false. On February 15, the eurozone will disclose its industrial production data and Christine Lagarde will deliver a speech, which is the main event of the day. The US will publish reports of secondary importance, including industrial production and retail sales figures. During the European session, the US dollar may continue gaining in value amid yesterday's CPI report.
What we see on the trading charts:
Price levels of support and resistance are thick red lines, near which the movement may end. They do not provide trading signals.
The Kijun-sen and Senkou Span B lines are the lines of the Ichimoku indicator, moved to the one-hour chart from the 4-hour one. They are strong lines.
Extreme levels are thin red lines from which the price bounced earlier. They provide trading signals.
Yellow lines are trend lines, trend channels, and any other technical patterns.
Indicator 1 on the COT charts reflects the net position size of each category of traders.
Indicator 2 on the COT charts reflects the net position size for the non-commercial group.
InstaForex analytical reviews will make you fully aware of market trends! Being an InstaForex client, you are provided with a large number of free services for efficient trading.


