 Maradok
Kereskedési feltételek
Products
Eszkozok


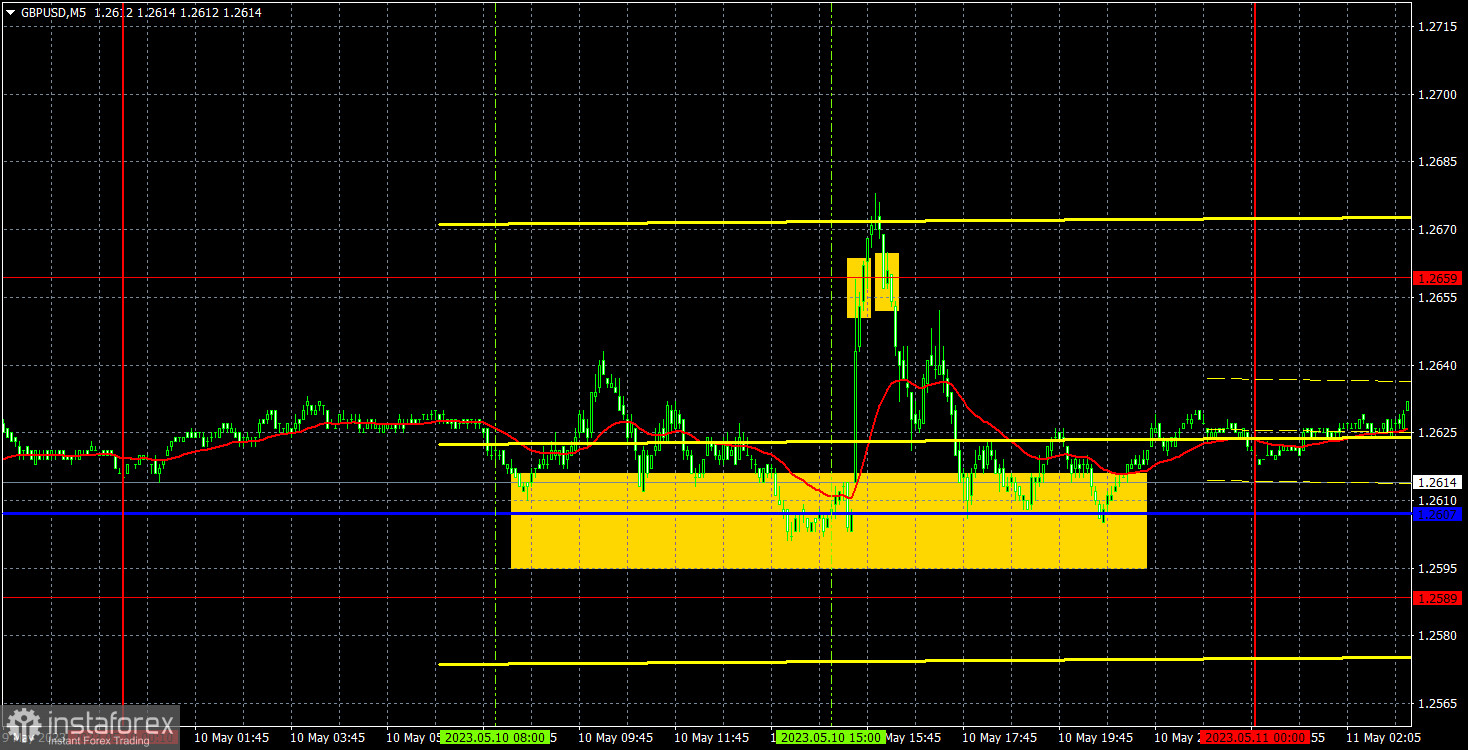
The GBP/USD pair did not even try to start a downward correction on Wednesday after it rose by another couple of hundred pips. Now GBP/USD is locked in the 1.2589-1.2666 sideway channel. The sterling still feels just fine. The last bullish sequence unfolded without fundamental reasons. In fact, the pound sterling has been advancing over the past 2 months, but the market continues to buy the pound, like bitcoin. To be fair, yesterday the British currency practically did not grow. After the publication of the US inflation data, the bulls were delighted (though why?) and rushed to buy the GBP/USD again. An hour later, their zeal ebbed away, and the pair very quickly returned to its opening levels. As we have already said, the US inflation report cannot be defined as negative for the dollar. The US dollar did not fall at the end of the day. It's already progress for the greenback.
GBP/USD generated quite a lot of trading signals on Wednesday. The pair bounced off the critical line six times, but these signals did not bring much profit to traders, since the only time the target level was hit happened in the early trading hours of the American session after the publication of the inflation report. That is the time when the market should have been left. The very first signals to buy were closed at best by Stop Losses at breakeven. The signal to buy near 1.2659 should not have been worked out, since at that time the upward movement could already be coming to an end. But the signal to sell near the same level could be exploited. It brought a small profit which was probably "eaten" by the first buy deals.
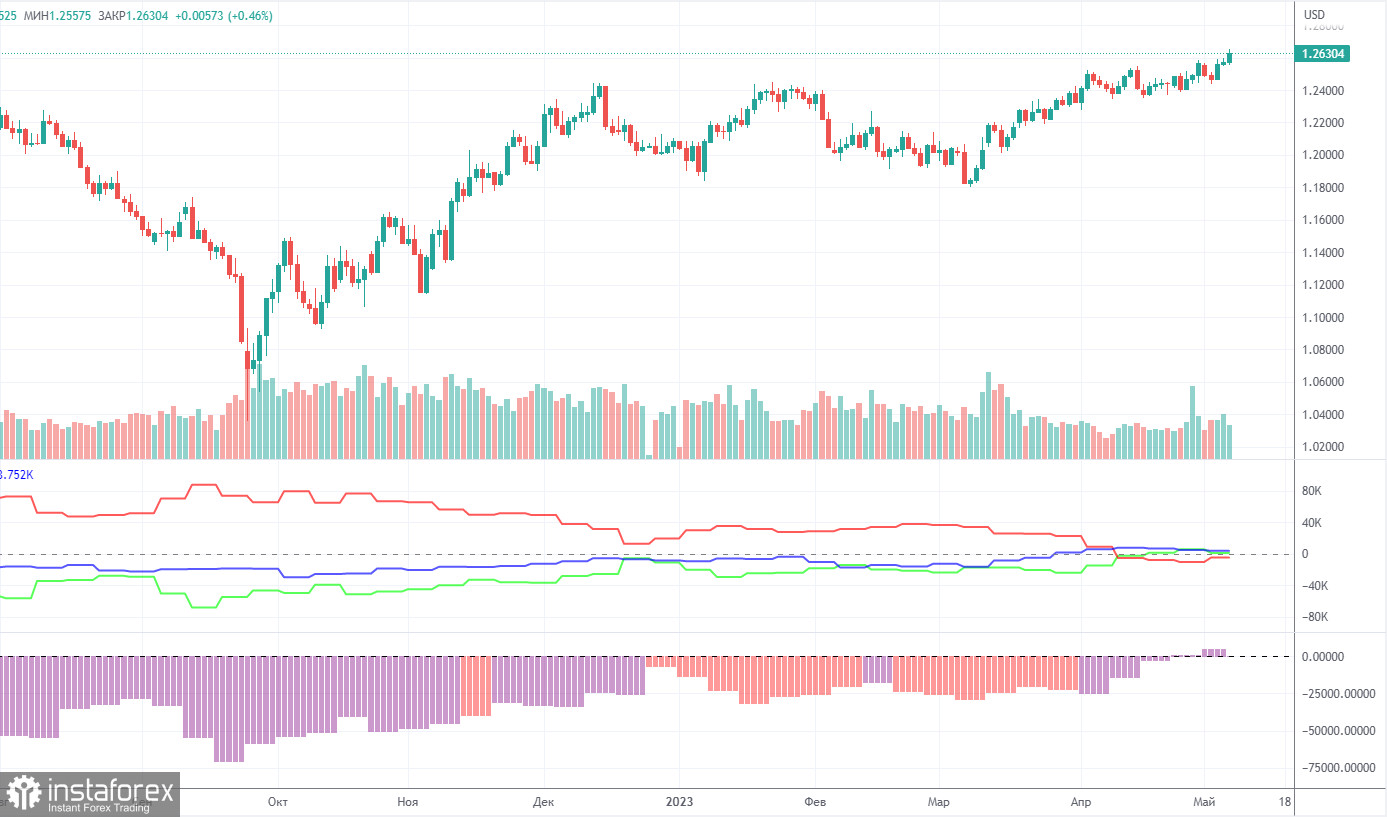
According to the latest report on GBP/USD, the non-commercial group closed 700 BUY contracts and opened 4K SELL contracts. Thus, the net position of non-commercial traders decreased by 4,700, but in general, continues to grow. The net position indicator has been growing steadily over the past 8-9 months, but the sentiment of market makers has remained bearish all this time (only now we can formally define market sentiment as bullish). The pound sterling has been growing against the US dollar in the medium term, but it is very difficult to answer the question about the underlying reason for the sterling's strength from a fundamental point of view. We absolutely do not rule out the possibility of a strong fall in the pound in the near future.
Both EUR/USD and GBP/USD are following the same pattern now, but at the same time, the net position on the euro is positive and already even suggests that the bullish momentum is easing. Speaking of the pound, we are still betting on GBP's further growth. The British currency has already jumped by more than 2,200 pips, which is a significant rise. Without a strong downward correction, it will be absolutely illogical to extend a further rally. The Non-commercial group now has a total of 58.6K SELL contracts and 57.6K BUY contracts. We remain skeptical about the long-term growth of the British currency and expect it to fall, but the market sentiment remains bullish.
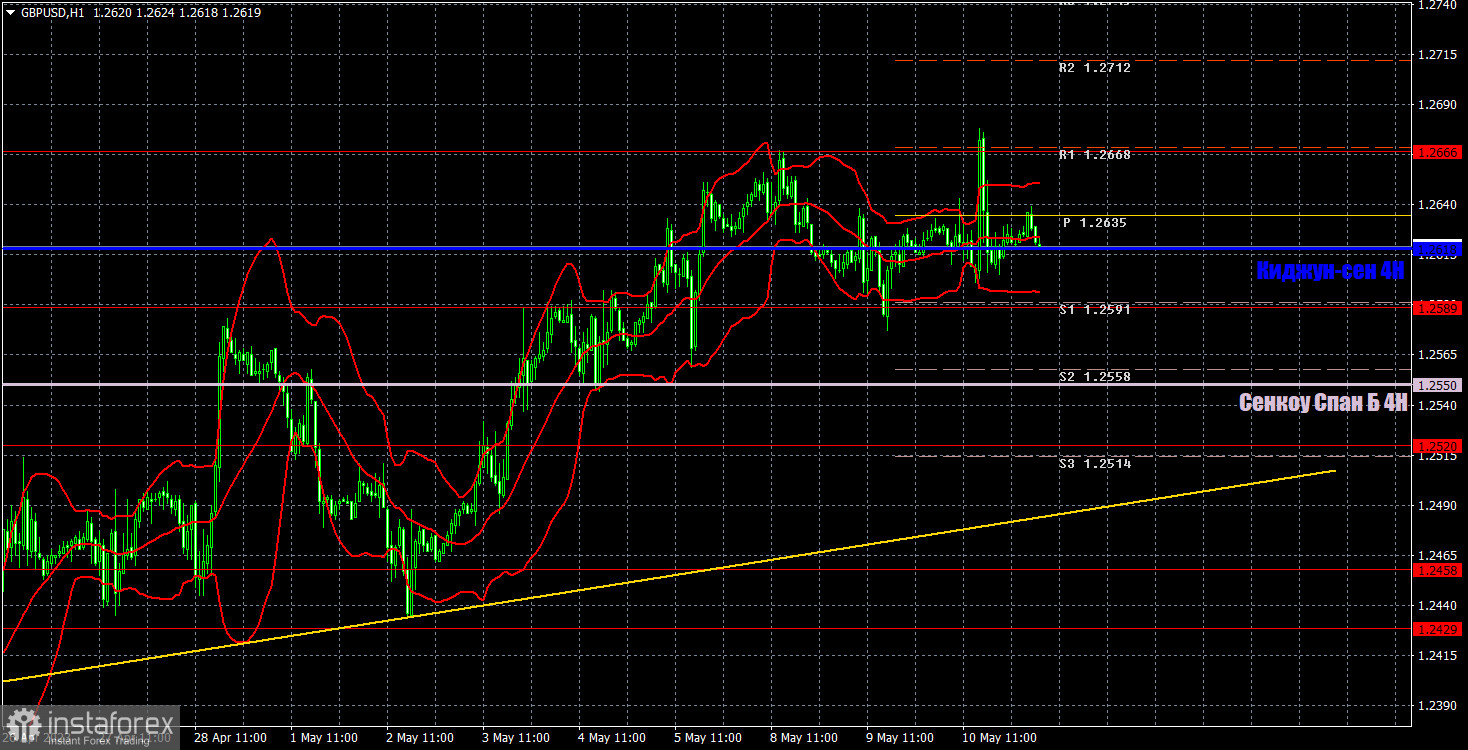
On the hourly timeframe, the GBP/USD pair continues its upward movement and is located above the lines of the Ichimoku indicator. Therefore, despite the overbought status of the pair, there is not a single signal to sell now. When sell signals pop up, oddly, they are not worked out by the market. All in all, the sterling has been extending its unreasonable strength and the next ascending trend line has not been broken yet.
On May 11, we identify the following important levels: 1.2349, 1.2429-1.2458, 1.2520, 1.2589, 1.2666, and 1.2762. Senkou Span B (1.2550) and Kijun-sen (1.2618) lines can also be sources of signals. Signals can be generated by dips and overcoming of these levels and lines. The Stop Loss level is recommended to be set to breakeven when the price passes 20 pips in the right direction. Ichimoku indicator lines can move during the day, which should be taken into account when identifying trading signals. The chart also contains support and resistance levels that can be used to take profits on trades.
A policy meeting of the Bank of England is scheduled for Thursday in the UK. The market is anticipating the announcement of the policy update. The event will certainly trigger higher volatility, but it is hardly possible to predict in which direction the pair will move. The economic calendar for the US contains only insignificant publications of secondary importance. Anyway, the Bank of England's policy decision will hog the limelight today.
Comments on charts
Support and resistance price levels (resistance/support) are thick red lines around which the price may stop its move. They are not sources of trading signals.
Kijun-sen and Senkou Span B lines are Ichimoku indicator lines transferred to the 1-hour timeframe from the 4-hour timeframe. They are strong lines.
Extreme levels are thin red lines from which the price previously bounced. They are sources of trading signals.
Yellow lines are trend lines, trend channels, and any other technical patterns.
Indicator 1 on COT charts means the size of the net position for each category of traders.
Indicator 2 on COT charts means the size of the net position for the "Non-commercial" group.
InstaForex analytical reviews will make you fully aware of market trends! Being an InstaForex client, you are provided with a large number of free services for efficient trading.

