 Maradok
Kereskedési feltételek
Products
Eszkozok


The GBPUSD pair faced strong negative pressure on Wednesday, which clearly does not correspond to the fundamental and macroeconomic backdrop we received throughout the day. It started falling at night, continued to do so during the European session, and intensified during the US session. There were only two events to take note of: Federal Reserve Chairman Jerome Powell's speech and Bank of England Governor Andrew Bailey's speech. Powell said that the majority of the monetary committee supports a further 0.5% increase in the key interest rate, while Bailey signaled that UK interest rates would likely remain 'higher for longer'. Both central bank heads seemed to maintain a hawkish stance, but surprisingly, the dollar strengthened. Why?
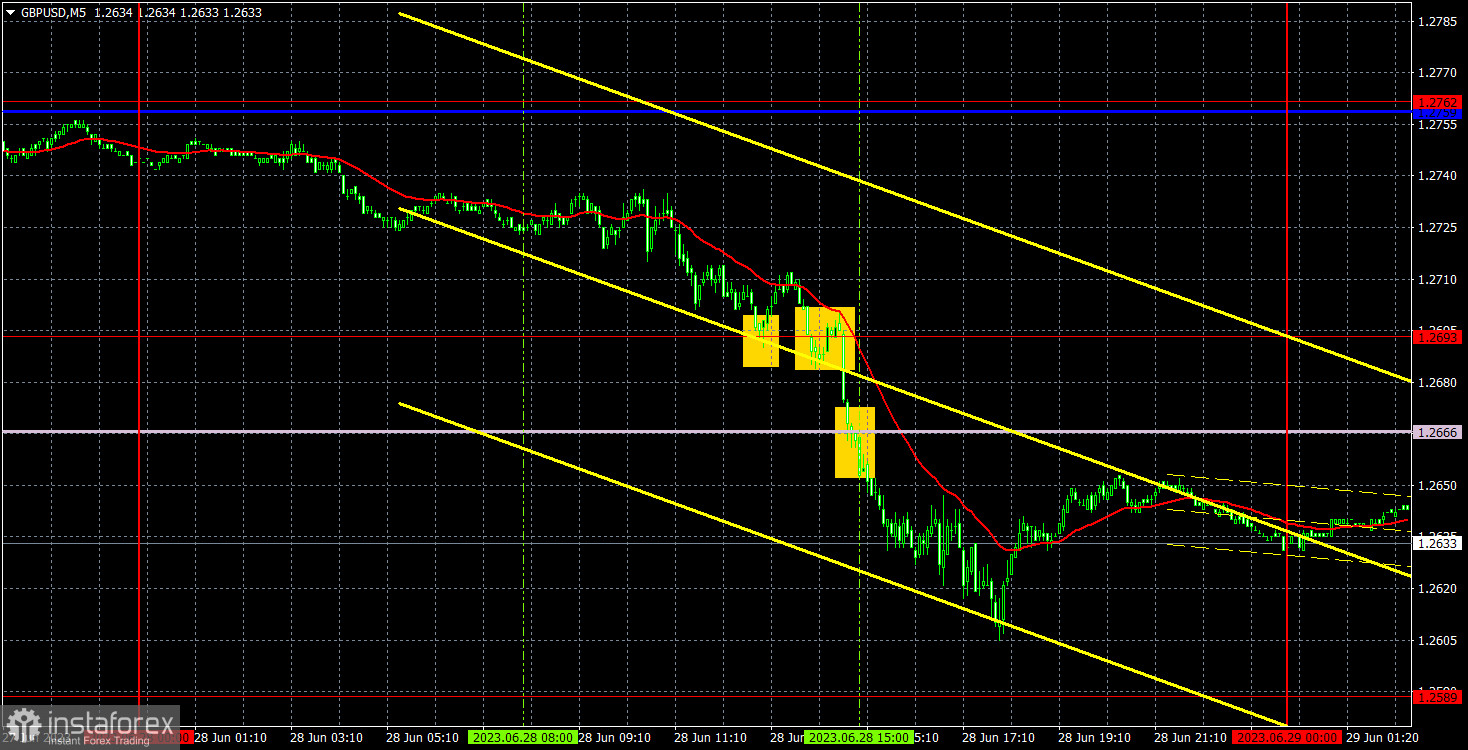
It's because the pound has been overbought for several months now. We have long been anticipating its downturn as all possible bullish factors have already been priced in. Last week, the pound failed to show growth despite having all the necessary grounds for it. We believe this may be a turning point in the uptrend. There were several entry points yesterday. Initially, the pair rebounded from the 1.2693 level, which was a clearly false signal, especially ahead of Powell and Bailey's speeches. To avoid losses, it was better not to open a position or to close it prior to these events. Subsequently, two sell signals materialized as the pair broke through the 1.2693 level and the Senkou Span B line. After that the pair fell by around 45 pips, providing traders with a profit of 20-30 pips on this trade.
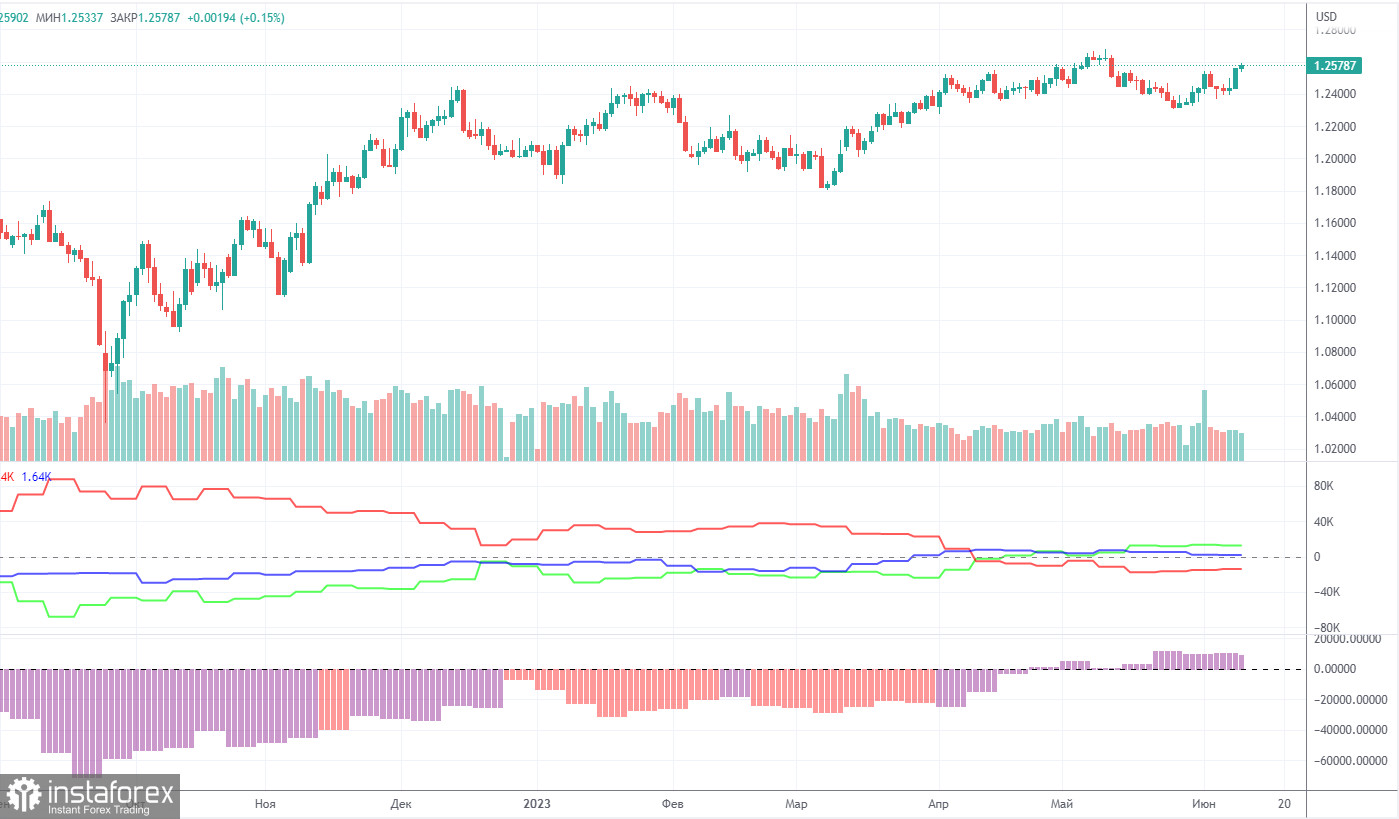
According to the latest report, non-commercial traders opened 25,100 long positions and closed 14,600 short ones. The net position increased by 39,700 in just a week and continues to grow. Over the past 9-10 months, the net position has been on the rise. We are approaching a point where the net position has grown too much to expect further growth. We assume that a prolonged bear run may soon begin, even though COT reports suggest a bullish continuation. It is becoming increasingly difficult to believe in it with each passing day. We can hardly explain why the uptrend should go on. However, there are currently no technical sell signals.
The pound has gained about 2,500 pips. Therefore, a bearish correction is now needed. Otherwise, a bullish continuation would make no sense. Overall, non-commercial traders hold 54,900 sell positions and 101,500 long ones. Such a gap suggests the end of the uptrend. We do not see the pair extending growth in the long term.
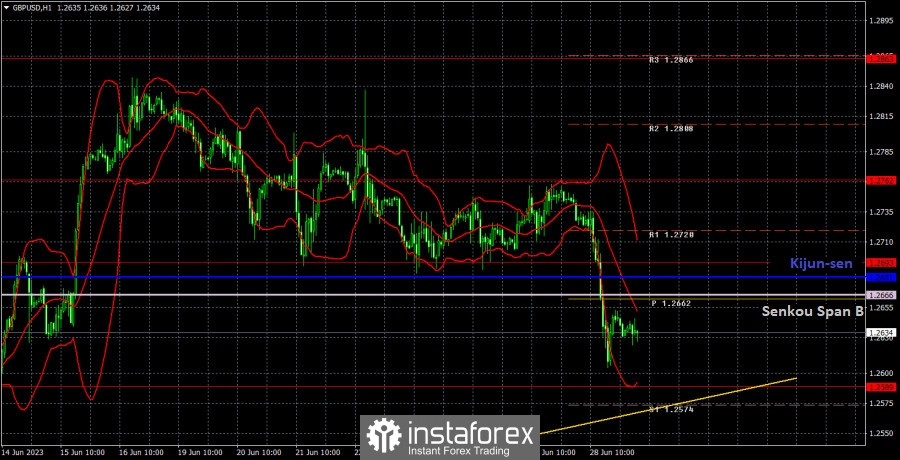
In the 1-hour chart, GBP/USD maintains a bullish bias, although it is correcting at the moment. The ascending trend line serves as a buy signal. However, we still believe that the British currency is overvalued and should fall in the medium term. The fundamental backdrop for the pound is getting weaker. The dollar also lacks a fundamental advantage but has already lost 2,500 pips over the past 10 months.
On June 29, trading levels are seen at 1.2349, 1.2429-1.2445, 1.2520, 1.2589, 1.2693, 1.2762, 1.2863, 1.2981-1.2987. The Senkou Span B line (1.2666) and the Kijun-sen line (1.2681) may also generate signals when the price either breaks or bounces off them. A Stop Loss should be placed at the breakeven point when the price goes 20 pips in the right direction. Ichimoku indicator lines can move intraday, which should be taken into account when determining trading signals. There are also support and resistance which can be used for locking in profits.
There are no significant events lined up in the UK. Powell will give another speech, as well as the release of US GDP and unemployment claims reports. This may stir some market reaction, but is unlikely to be strong.
Resistance/support - thick red lines, near which the trend may stop. They do not make trading signals.
The Kijun-sen and Senkou Span B lines are the Ichimoku indicator lines moved to the hourly timeframe from the 4-hour timeframe. They are also strong lines.
Extreme levels are thin red lines, from which the price used to bounce earlier. They can produce trading signals.
Yellow lines are trend lines, trend channels, and other technical patterns.
Indicator 1 on the COT chart is the size of the net position of each trader category.
Indicator 2 on the COT chart is the size of the net position for the Non-commercial group of traders.
InstaForex analytical reviews will make you fully aware of market trends! Being an InstaForex client, you are provided with a large number of free services for efficient trading.


