 Maradok
Kereskedési feltételek
Products
Eszkozok


The focus of traders following the dynamics of the New Zealand and American dollars is on the publications of important macro statistics from the U.S. and New Zealand today at 12:30 (GMT) and on Wednesday at the beginning of the trading day.
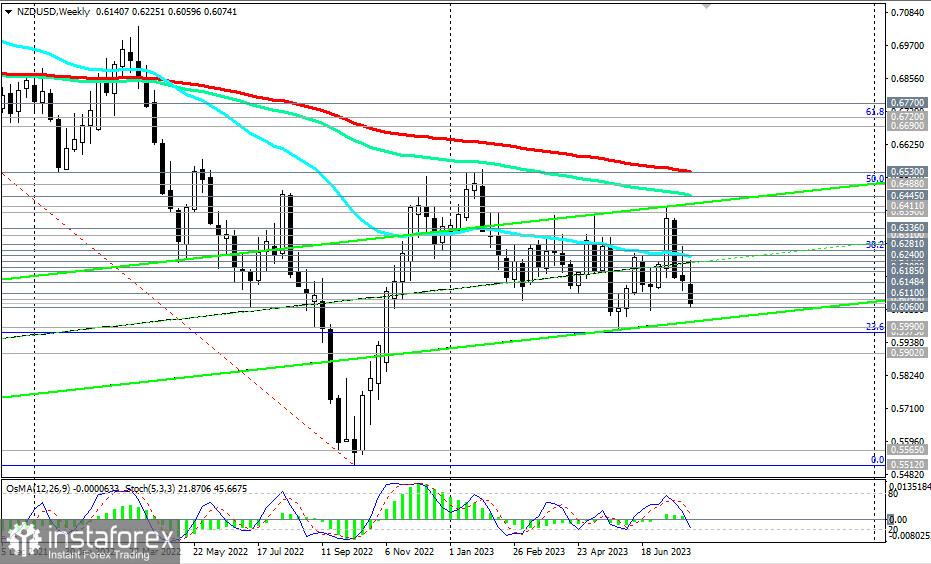
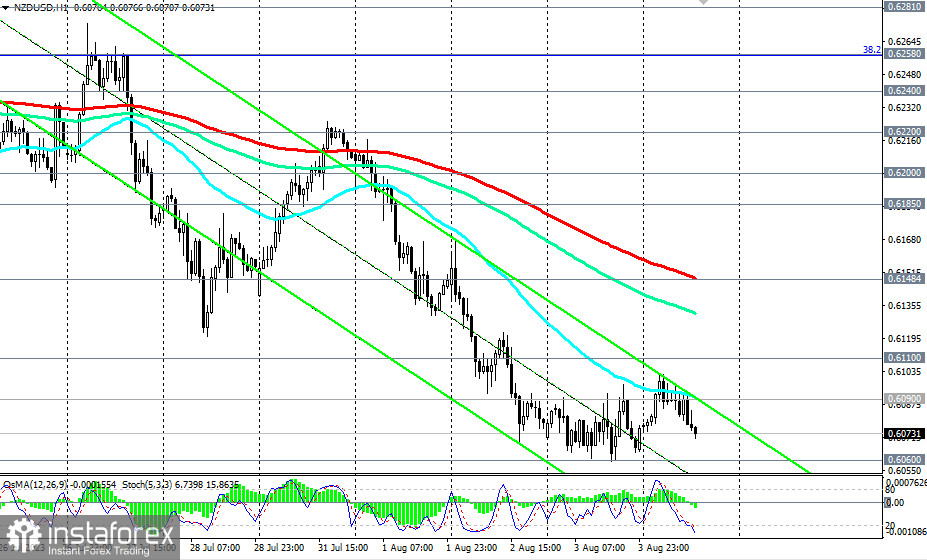
From a technical point of view, NZD/USD is developing a downward trend, moving in the bearish market zone, short-term—below the resistance levels of 0.6148 (200 EMA on the 1-hour chart), 0.6185 (200 EMA on the 4-hour chart), medium-term—below the resistance levels of 0.6220 (200 EMA on the daily chart), 0.6240 (50 EMA on the weekly chart), and long-term—below the resistance levels of 0.6445 (144 EMA on the weekly chart), 0.6500, 0.6530 (200 EMA on the weekly chart).
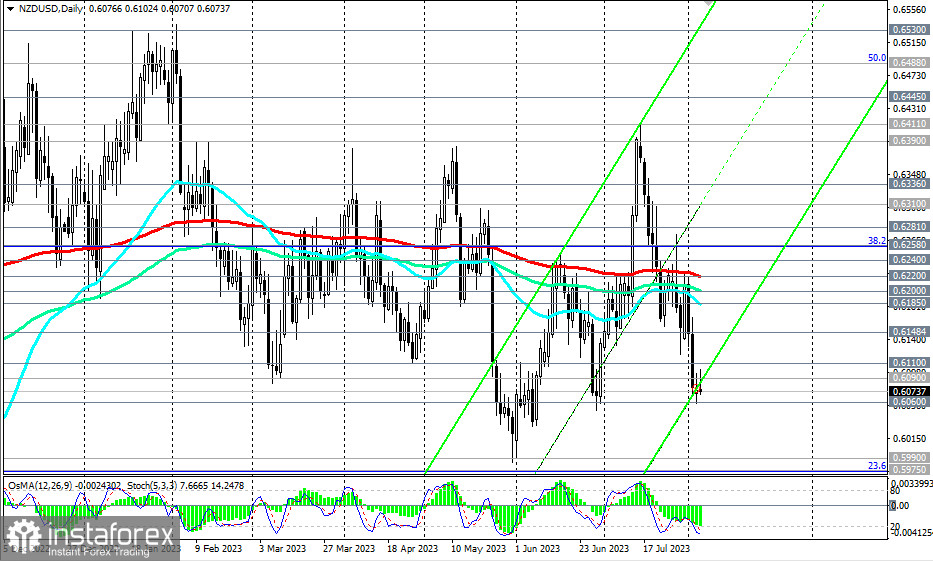
Technical indicators OsMA and Stochastic on the daily and weekly charts are also on the sellers' side, signaling the appropriateness of short positions.
In the main scenario, after breaking the local support level of 0.6060, we expect further decline of the pair with immediate targets at support levels of 0.6000, 0.5975 (23.6% Fibonacci level in the downward wave from 0.7465 in February 2021 to 0.5510 reached in October 2022).
On the other hand, a breakout of the local resistance level of 0.6110 may become the first signal for the development of an alternative scenario for the pair's growth, and a breakout of the resistance level of 0.6148 will confirm it.
In a more favorable scenario for NZD, and after breaking the key resistance levels of 0.6220, 0.6240, the pair may rise to key resistance levels of 0.6445, 0.6480 (50% Fibonacci level), 0.6530 (200 EMA on the weekly chart), separating the long-term bullish trend from the bearish one. Their breakout, in turn, will take NZD/USD to the zone of a long-term bullish market, and a break of the resistance level of 0.6690 (200 EMA on the monthly chart) will take it to the global bullish market zone.
Support levels:0.6060, 0.6000, 0.5990, 0.5975, 0.5900
Resistance levels: 0.6090, 0.6100, 0.6110, 0.6148, 0.6185, 0.6200, 0.6220, 0.6240, 0.6258, 0.6280, 0.6310, 0.6336, 0.6390, 0.6410, 0.64 45, 0.6488, 0.6500, 0.6530
InstaForex analytical reviews will make you fully aware of market trends! Being an InstaForex client, you are provided with a large number of free services for efficient trading.

