 Maradok
Kereskedési feltételek
Products
Eszkozok


Tuesday turned out to be almost the same as Monday; the macroeconomic calendar was practically empty. The only thing worth noting was the statistics on existing home sales in the United States, which decreased by 2.2% in July. Despite this negative news, the U.S. dollar continued to strengthen, which was likely influenced by the statement of Richmond Federal Reserve President Tom Barkin that "if inflation remains high and demand shows no signs, it will require a tightening of monetary policy."
As a result of a sharp reduction in the volume of long positions, the Euro's exchange rate to the U.S. dollar reached a local low within the current correction cycle. This price movement once again highlighted the prevailing interest of traders in short positions on the Euro.
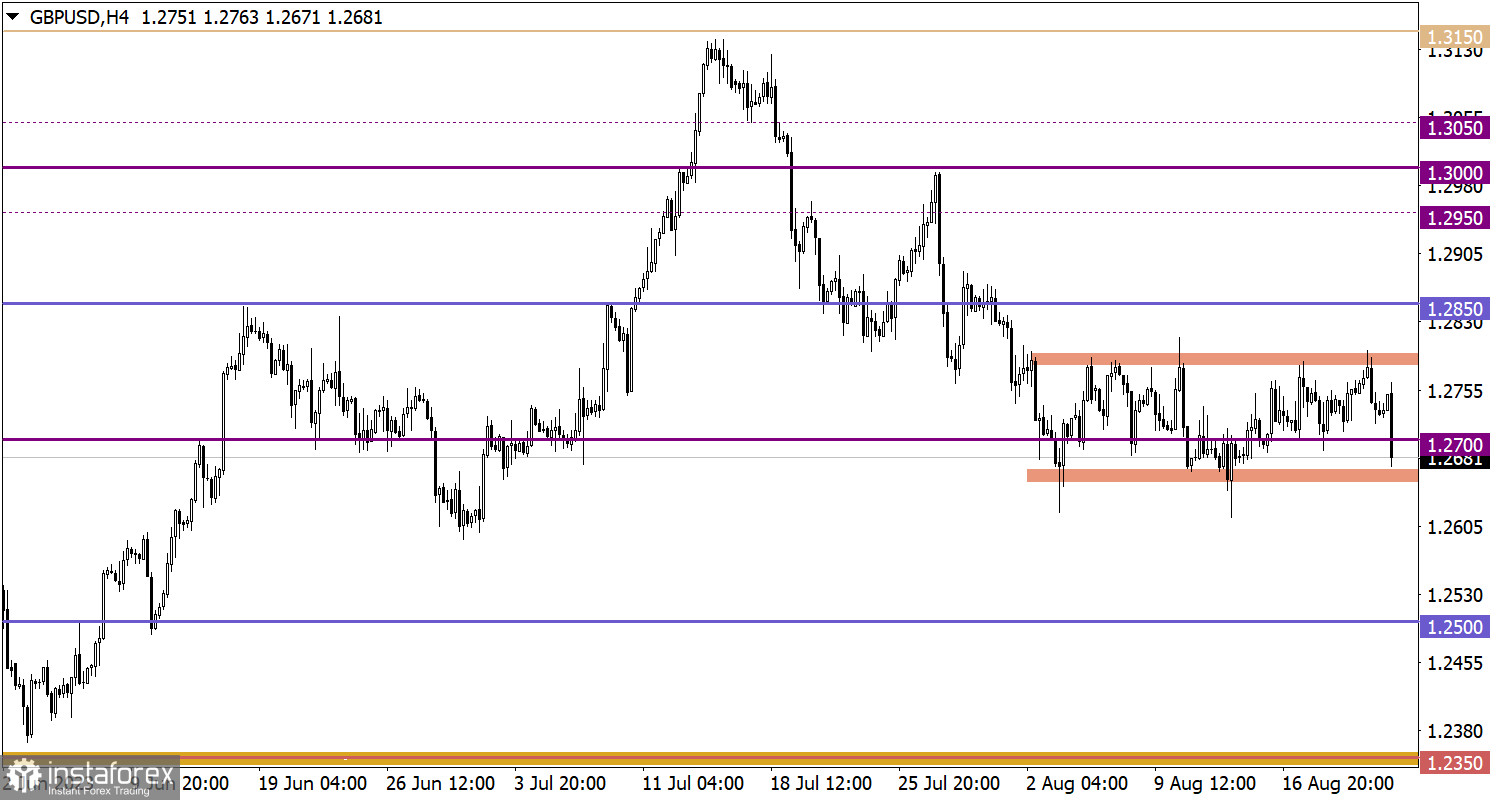
On the other hand, the GBP/USD currency pair reached the upper boundary of the sideways channel (1.2650/1.2800) during its upward cycle. As a result, there was a reduction in the volume of long positions on the British pound, which caused a price rebound.

Today's macroeconomic calendar is packed with statistical data; the publication of business activity indices in the EU, UK, and USA is expected. Given that these data are preliminary estimates, they can cause speculative movements in the financial markets.
Time Targeting:
The business activity index in the EU was published at 08:00 UTC; the composite index showed a decline.
The business activity index in the UK was released at 08:30 UTC, and the data was worse than expected.
The business activity index in the USA is expected at 13:45 UTC.
A stable price retention below the 1.0850 mark may strengthen the current downward cycle. It's important to emphasize that the recent price decline already led to the 1.0800/1.0850 area, which previously served as a support for sellers. At the moment, traders are aiming to break through this area, indicated by the price holding below 1.0850.
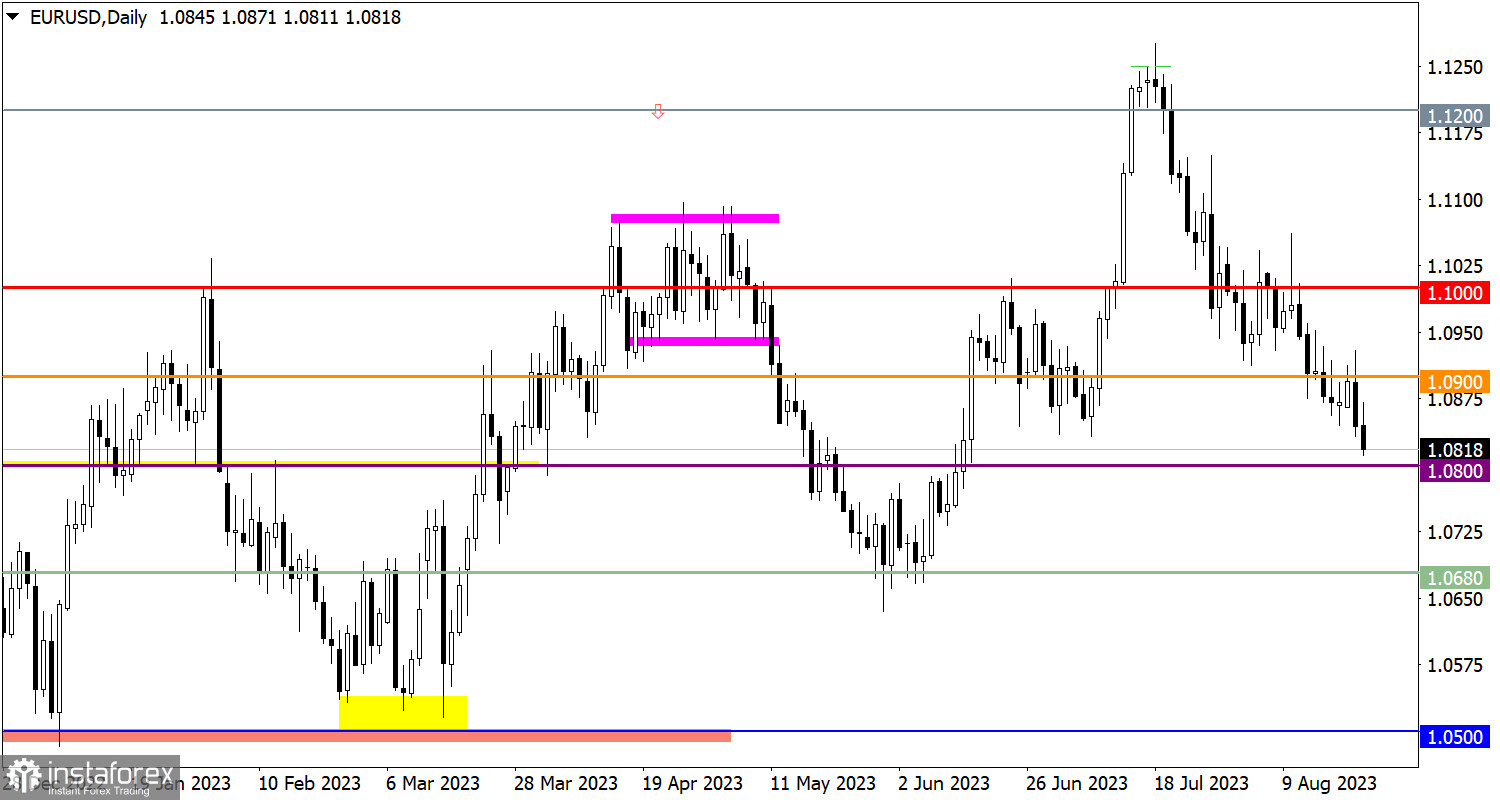
In this situation, there are two methods available: the breakout method and the price rebound method from the established range boundary.
The scenario of breaking the lower boundary of the sideways movement will be relevant if the price continues to hold below the 1.2650 level. Such a move can contribute to the continuation of the downward correction.
The alternative scenario suggests a sequential recovery of the pound sterling relative to the current correction movement. The primary technical signal for possible growth might appear if the price reliably holds above the 1.2800 level.
The candlestick chart type is white and black graphic rectangles with lines above and below. With a detailed analysis of each individual candle, you can see its characteristics relative to a particular time frame: opening price, closing price, intraday high and low.
Horizontal levels are price coordinates, relative to which a price may stop or reverse its trajectory. In the market, these levels are called support and resistance.
Circles and rectangles are highlighted examples where the price reversed in history. This color highlighting indicates horizontal lines that may put pressure on the asset's price in the future.
The up/down arrows are landmarks of the possible price direction in the future.
InstaForex analytical reviews will make you fully aware of market trends! Being an InstaForex client, you are provided with a large number of free services for efficient trading.


