 Maradok
Kereskedési feltételek
Products
Eszkozok


Tuesday turned out to be almost the same as Monday, with the macroeconomic calendar remaining practically empty. The only thing that market participants could pay attention to was the statistics on job openings in the United States. So, the labor market continues to cool off. According to July data, there is a decrease in the number of job openings by 338,000 to 8.83 million; the June data was also revised downward.
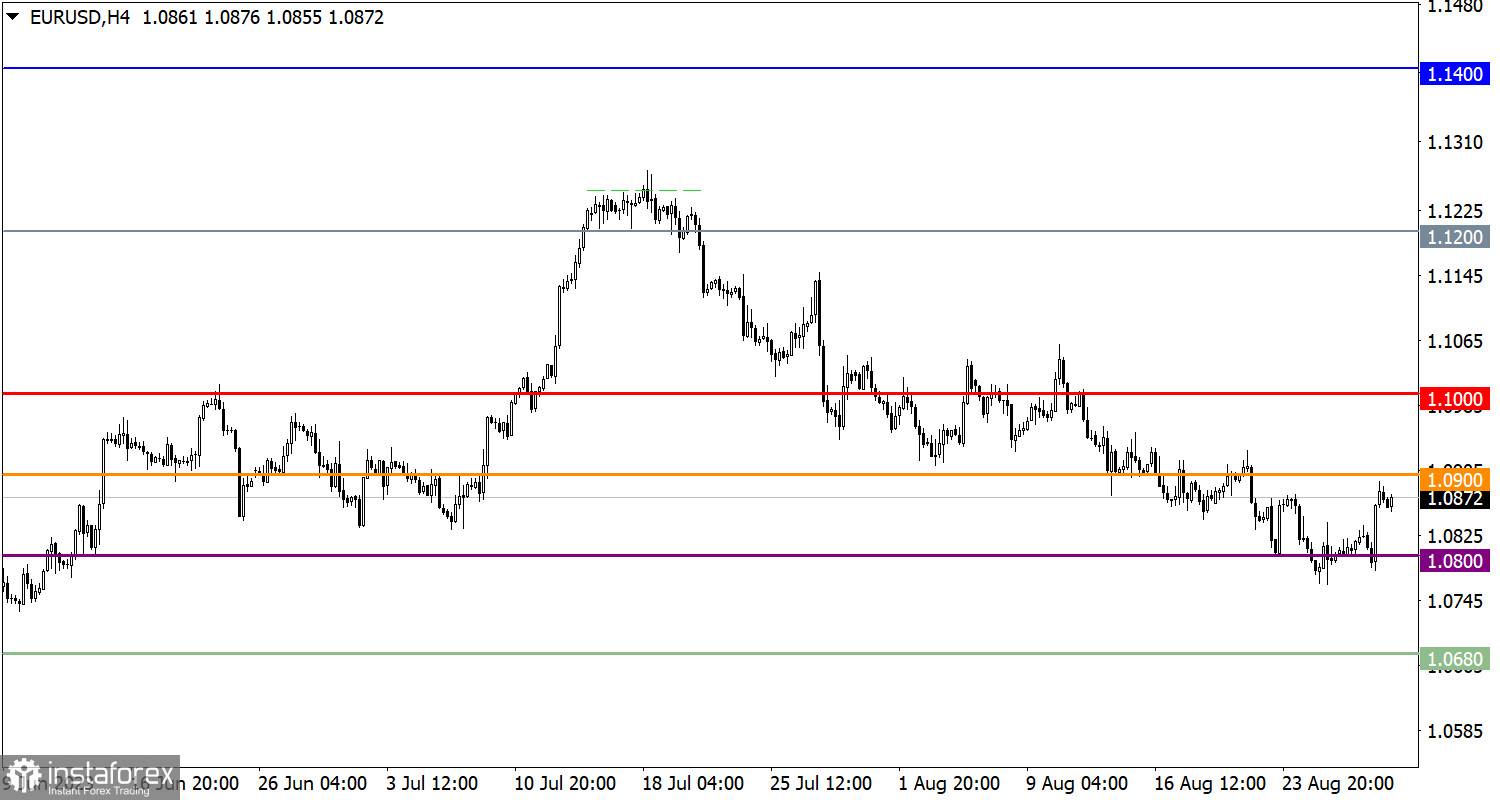
The EUR/USD currency pair shows initial technical signals of recovery from the recent decline. The support level around 1.0800 is in play, which has led to a reduction in the volume of short positions.
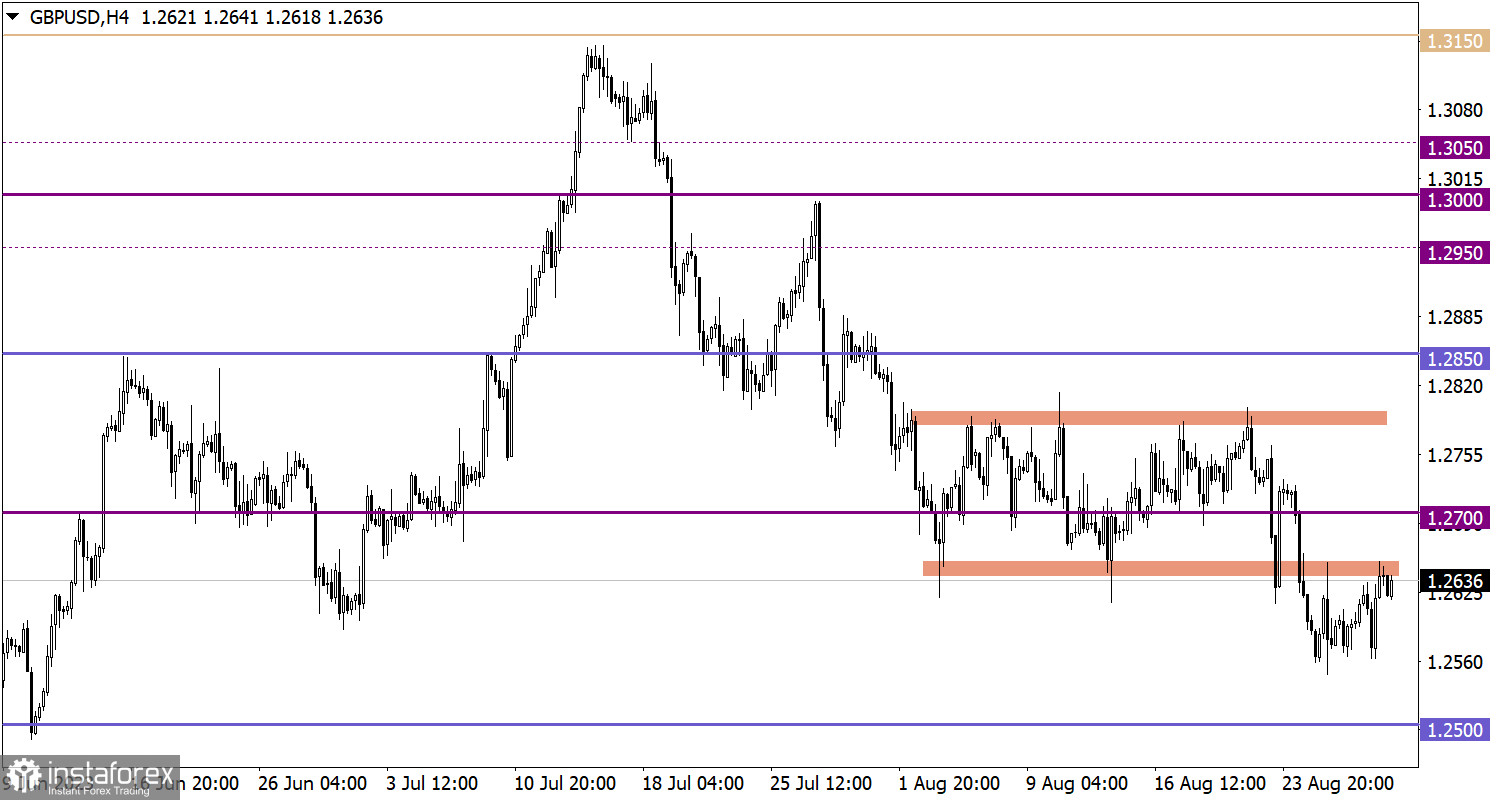
As for the GBP/USD currency pair, during the technical pullback, it returned to the lower boundary of the previously established sideways channel between 1.2650 and 1.2800. As a result, there is a reduction in the volume of long positions on the British pound.

Today, traders should pay attention to the ADP Employment Report in the private sector of the United States. This report is expected to demonstrate employment growth at a level of 195,000. This result is quite promising and may indicate a possible decrease in the unemployment rate. Such a development, of course, would contribute to the strengthening of the dollar. At the same time, the second estimate of the U.S. GDP for the second quarter probably won't attract much attention, as it is likely to confirm the initial estimate, which is already factored into the market.
In the current situation, we can observe an increase in the volume of long positions on the euro, which is confirmed by the intense rise in the currency's value. A further signal for technical growth will become evident after a sustained hold of the price above the 1.0900 mark. For now, the level of 1.0900 is viewed by market participants as a potential resistance.
For further growth of the pound sterling, it is important to ensure a steady price retention above the 1.2650 level. In this case, a movement leading at least to the 1.2700 mark is possible, followed by further development within the previous range of 1.2650/1.2800. At the same time, an alternative scenario is possible if the price bounces off the 1.2650 boundary. If this happens, there is a possibility of updating the local low of the downward trend.
The candlestick chart type is white and black graphic rectangles with lines above and below. With a detailed analysis of each individual candle, you can see its characteristics relative to a particular time frame: opening price, closing price, intraday high and low.
Horizontal levels are price coordinates, relative to which a price may stop or reverse its trajectory. In the market, these levels are called support and resistance.
Circles and rectangles are highlighted examples where the price reversed in history. This color highlighting indicates horizontal lines that may put pressure on the asset's price in the future.
The up/down arrows are landmarks of the possible price direction in the future.
InstaForex analytical reviews will make you fully aware of market trends! Being an InstaForex client, you are provided with a large number of free services for efficient trading.


