 Maradok
Kereskedési feltételek
Products
Eszkozok


GBP/USD continued to trade higher on Thursday. The pound sterling, which keeps rising almost every day without grounds or for no reasons, naturally took advantage of yet another "gift of fate" in the form of a U.S. inflation report that slowed more than expected. All of the other reports no longer mattered. However, the British economy grew more than the market expected in May. Perhaps this provided additional support to buyers of GBP/USD, although the market usually does not react to monthly GDP data.
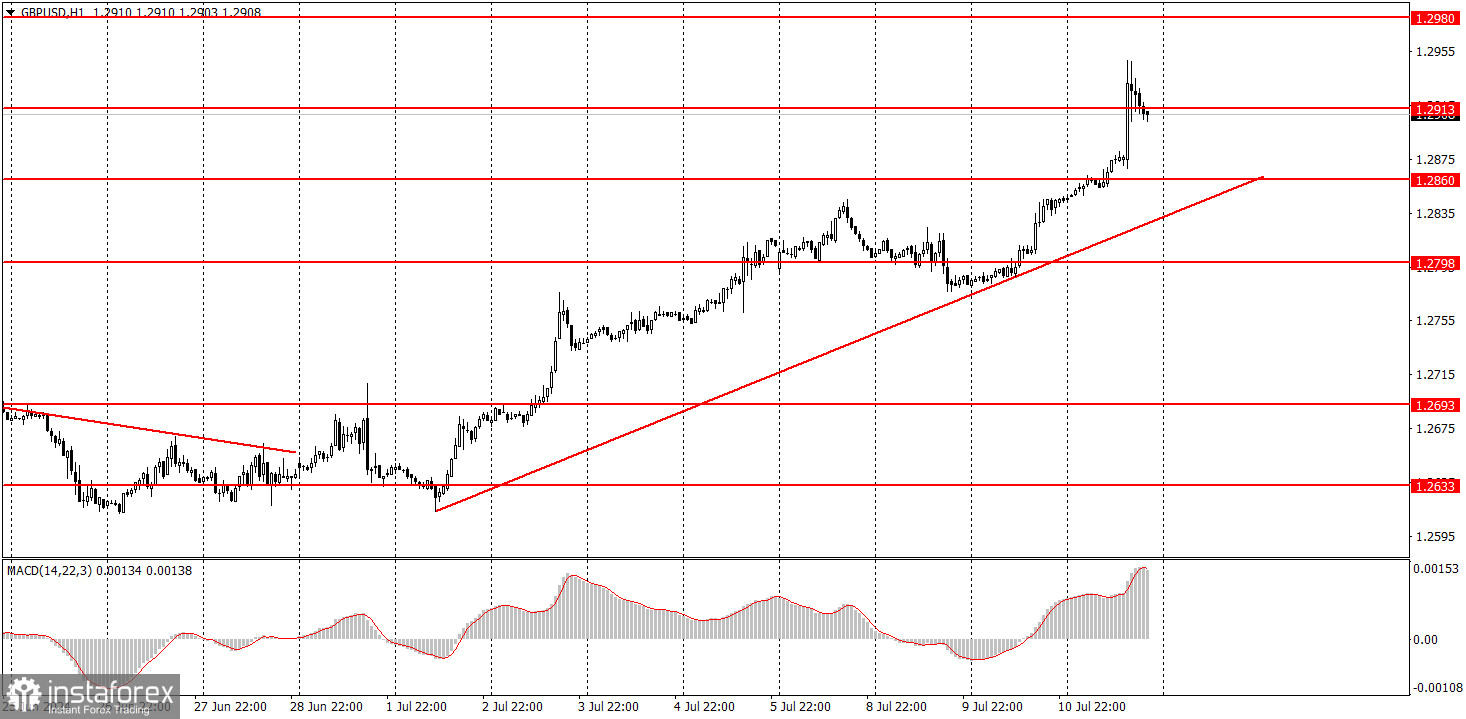
In summary, the pair continues to show positive trades. Now traders have an ascending trend line at their disposal, but take note that in the past, breaking the ascending trend line has not resulted in the pound's decline. The pound continues to advance for any reason, and it manages to rise no matter what happens.
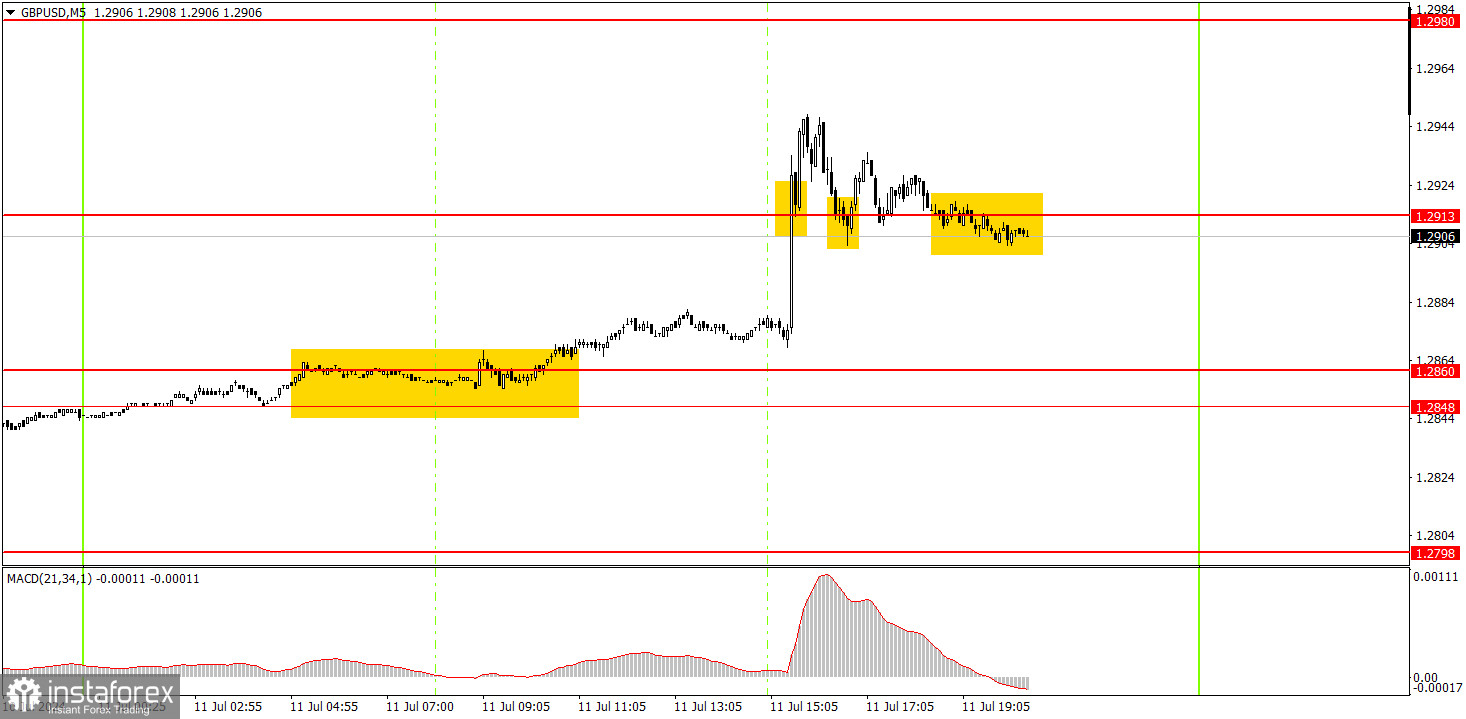
On the 5-minute timeframe on Thursday, a good buy signal was formed during European trading hours. The price broke through the 1.2848-1.2860 area, so traders could open long positions. Eventually, the pound surpassed the level of 1.2913, but by the end of the day, the price fell below this mark. At that moment, long positions could be closed with a profit of about 35 pips. The sell signal in the form of the price consolidating below 1.2913 could also be executed. Today, the pair will likely experience much lower volatility, and the British pound has long been due for a bearish correction.
On the hourly chart, GBP/USD continues to show promising signs of forming a downtrend, but this doesn't mean that the pair can't form an upward trend. The pair has been rising again, and overall, it continues to exhibit erratic and illogical movements. Currently, the pound sterling has surpassed its latest local high and continues to ignore the fundamental backdrop. However, no one can deny that the recent economic reports have been supporting the pound.
On Friday, the pound sterling may continue a new round of the downward movement, and the price may gradually fall towards the area of 1.2848-1.2860. No significant reports are scheduled for today, but the market may find a reason to buy even without them.
The key levels on the 5M chart are 1.2457, 1.2502, 1.2541-1.2547, 1.2605-1.2633, 1.2684-1.2693, 1.2748, 1.2791-1.2798, 1.2848-1.2860, 1.2913, and 1.2980. On Friday, the UK event calendar is empty, but the U.S. will release two reports that could also affect the pair's movement – the Consumer Sentiment Index and the Producer Price Index. But take note that these are not crucial data, and volatility may be low.
1) Signal strength is determined by the time taken for its formation (either a bounce or level breach). A shorter formation time indicates a stronger signal.
2) If two or more trades around a certain level are initiated based on false signals, subsequent signals from that level should be disregarded.
3) In a flat market, any currency pair can produce multiple false signals or none at all. In any case, the flat trend is not the best condition for trading.
4) Trading activities are confined between the onset of the European session and mid-way through the U.S. session, after which all open trades should be manually closed.
5) On the 30-minute timeframe, trades based on MACD signals are only advisable amidst substantial volatility and an established trend, confirmed either by a trendline or trend channel.
6) If two levels lie closely together (ranging from 5 to 15 pips apart), they should be considered as a support or resistance zone.
Support and Resistance price levels can serve as targets when buying or selling. You can place Take Profit levels near them.
Red lines represent channels or trend lines, depicting the current market trend and indicating the preferable trading direction.
The MACD(14,22,3) indicator, encompassing both the histogram and signal line, acts as an auxiliary tool and can also be used as a signal source.
Significant speeches and reports (always noted in the news calendar) can profoundly influence the price dynamics. Hence, trading during their release calls for heightened caution. It may be reasonable to exit the market to prevent abrupt price reversals against the prevailing trend.
Beginners should always remember that not every trade will yield profit. Establishing a clear strategy coupled with sound money management is the cornerstone of sustained trading success.
InstaForex analytical reviews will make you fully aware of market trends! Being an InstaForex client, you are provided with a large number of free services for efficient trading.

